Copyright
©The Author(s) 2004.
World J Gastroenterol. Feb 1, 2004; 10(3): 319-322
Published online Feb 1, 2004. doi: 10.3748/wjg.v10.i3.319
Published online Feb 1, 2004. doi: 10.3748/wjg.v10.i3.319
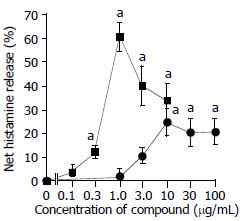
Figure 1 Anti-IgE and calcium ionophore induced histamine re-lease from colon mast cells.
The values shown are mean ± SEM for four separate experiments. Stimulus or HBSS alone was incubated with cells for 15 min before termination of the reactions. aP < 0.05 compared with spontaneous release group (paired Student’s t test).
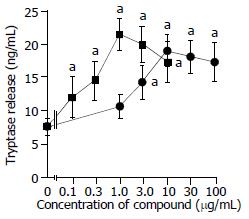
Figure 2 Anti-IgE and calcium ionophore induced tryptase re-lease from colon mast cells.
The values shown are mean ± SEM for four separate experiments. Stimulus or HBSS alone was incubated with cells for 15 min before termination of the reactions. aP < 0.05 compared with spontaneous release group (paired Student’s t test).
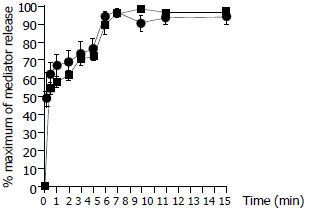
Figure 3 Time course for anti-IgE (10 µg/ml) induced release of tryptase (─■─) and histamine (─●─) from colon mast cells.
Data shown are mean ± SEM of four separate experiments.
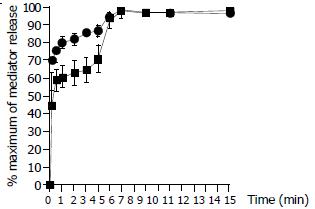
Figure 4 Time course for calcium ionophore (1 µg/ml) induced release of tryptase (─■─) and histamine (─●─) from colon mast cells.
Data shown are mean ± SEM of four separate experiments.
- Citation: He SH, Xie H, He YS. Induction of tryptase and histamine release from human colon mast cells by IgE dependent or independent mechanisms. World J Gastroenterol 2004; 10(3): 319-322
- URL: https://www.wjgnet.com/1007-9327/full/v10/i3/319.htm
- DOI: https://dx.doi.org/10.3748/wjg.v10.i3.319


