Copyright
©The Author(s) 2004.
World J Gastroenterol. Dec 15, 2004; 10(24): 3662-3665
Published online Dec 15, 2004. doi: 10.3748/wjg.v10.i24.3662
Published online Dec 15, 2004. doi: 10.3748/wjg.v10.i24.3662
Figure 1 Expression of c-myb mRNA, internal control and c-myb protein by RT-PCR, density and Western blot.
A: c-myb mRNA expression assayed by semi-quantitative RT-PCR analysis of total RNA. Co-amplification of GAPDH in all samples served as an internal standard. Lane 1: control HSC; Lane 2: pDOR treated HSC; Lane 3: pDOR-myb treated HSC; Lane M: 100 bp ladder. B: Relative expression levels are shown as percent of the internal control by densitometry scanning. The results were expressed as mean ± SE (n = 3). bP < 0.01 vs pDOR and control. C: Western-blotting of c-myb protein expression. Fifty µg of extracted cellular protein was loaded in each lane. Lane1: control HSC; Lane2: pDOR treated HSC; Lane3: pDOR-myb treated HSC.
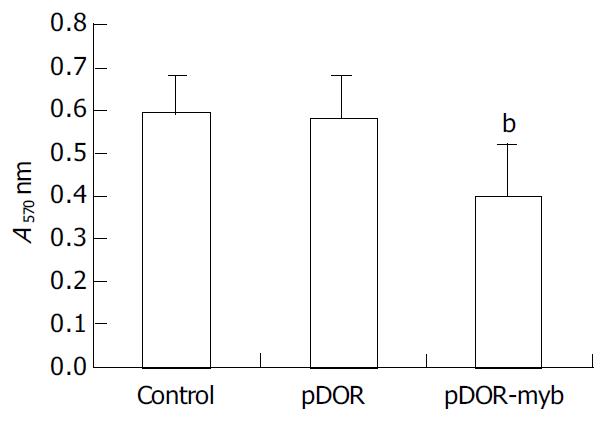
Figure 2 Measurements of cell proliferation with MTT method in three groups of HSCs.
The results were expressed as mean ± SE (n = 6). bP < 0.01 vs pDOR and control.
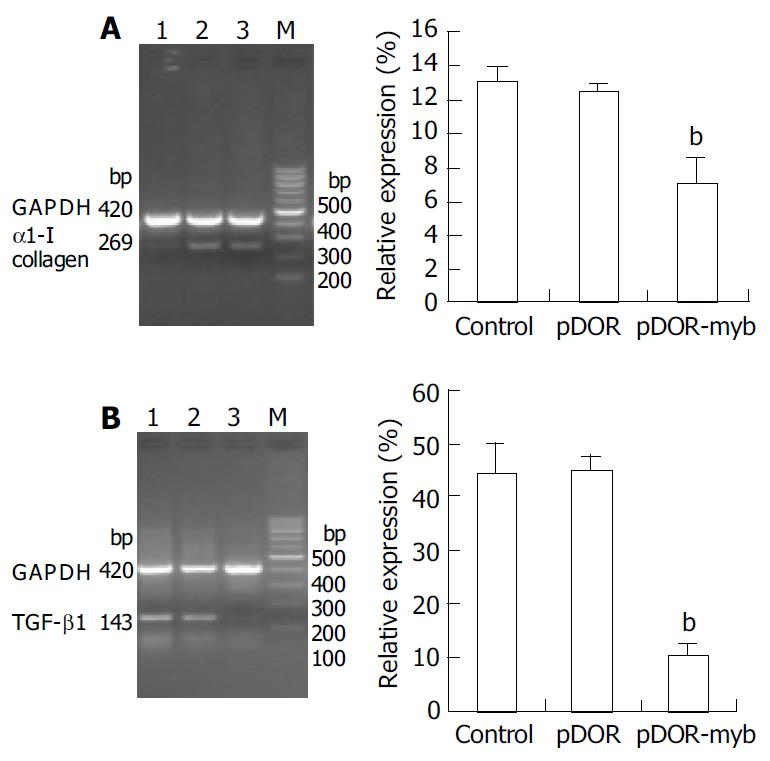
Figure 3 Expression of TGF-β1 and α1-I collagen mRNA.
A: α1-I collagen mRNA expression assayed by semi-quantitative RT-PCR analysis. Lane 1: pDOR-myb treated HSC; Lane 2: control HSC; Lane 3: pDOR treated HSC. B: TGF-β1 mRNA expression assayed by semi-quantitative RT-PCR analysis. Lane 1: pDOR treated HSC; Lane 2: control HSC; Lane 3: pDOR-myb treated HSC. The relative expression levels were shown as percent of the internal control by densitometry scanning. The results were expressed as mean ± SE (n = 3), bP < 0.01 vs pDOR and control. Co-amplification of GAPDH in all samples served as an inter-nal standard.
-
Citation: Ma HH, Yao JL, Li G, Yao CL, Chen XJ, Yang SJ. Effects of
c-myb antisense RNA on TGF-β1 and α1-I collagen expression in cultured hepatic stellate cells. World J Gastroenterol 2004; 10(24): 3662-3665 - URL: https://www.wjgnet.com/1007-9327/full/v10/i24/3662.htm
- DOI: https://dx.doi.org/10.3748/wjg.v10.i24.3662


