Copyright
©The Author(s) 2004.
World J Gastroenterol. Dec 15, 2004; 10(24): 3590-3596
Published online Dec 15, 2004. doi: 10.3748/wjg.v10.i24.3590
Published online Dec 15, 2004. doi: 10.3748/wjg.v10.i24.3590
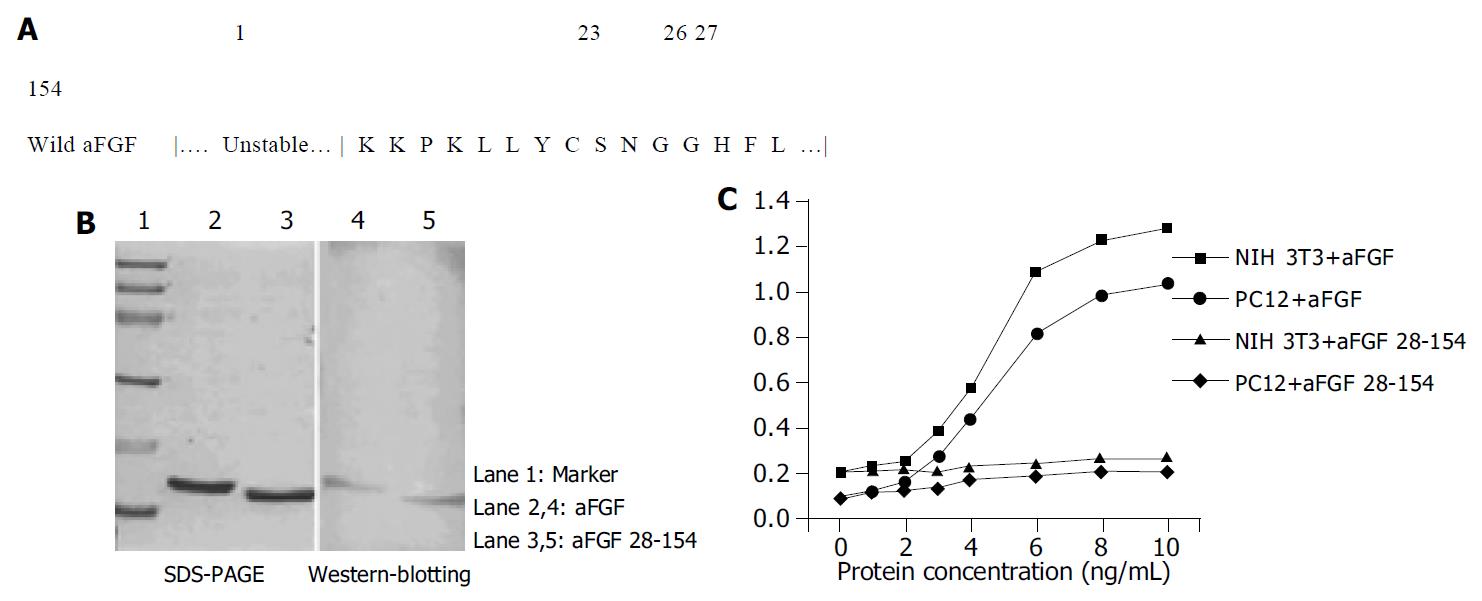
Figure 1 Loss of mitogenic activity in aFGF after modification.
A: Sequence comparison between modified aFGF (aFGF28-154) and the wild type. B: Western blot analysis of purified aFGF and aFGF28-154. C: MTT assay of the mitogenic activity of both aFGFs.
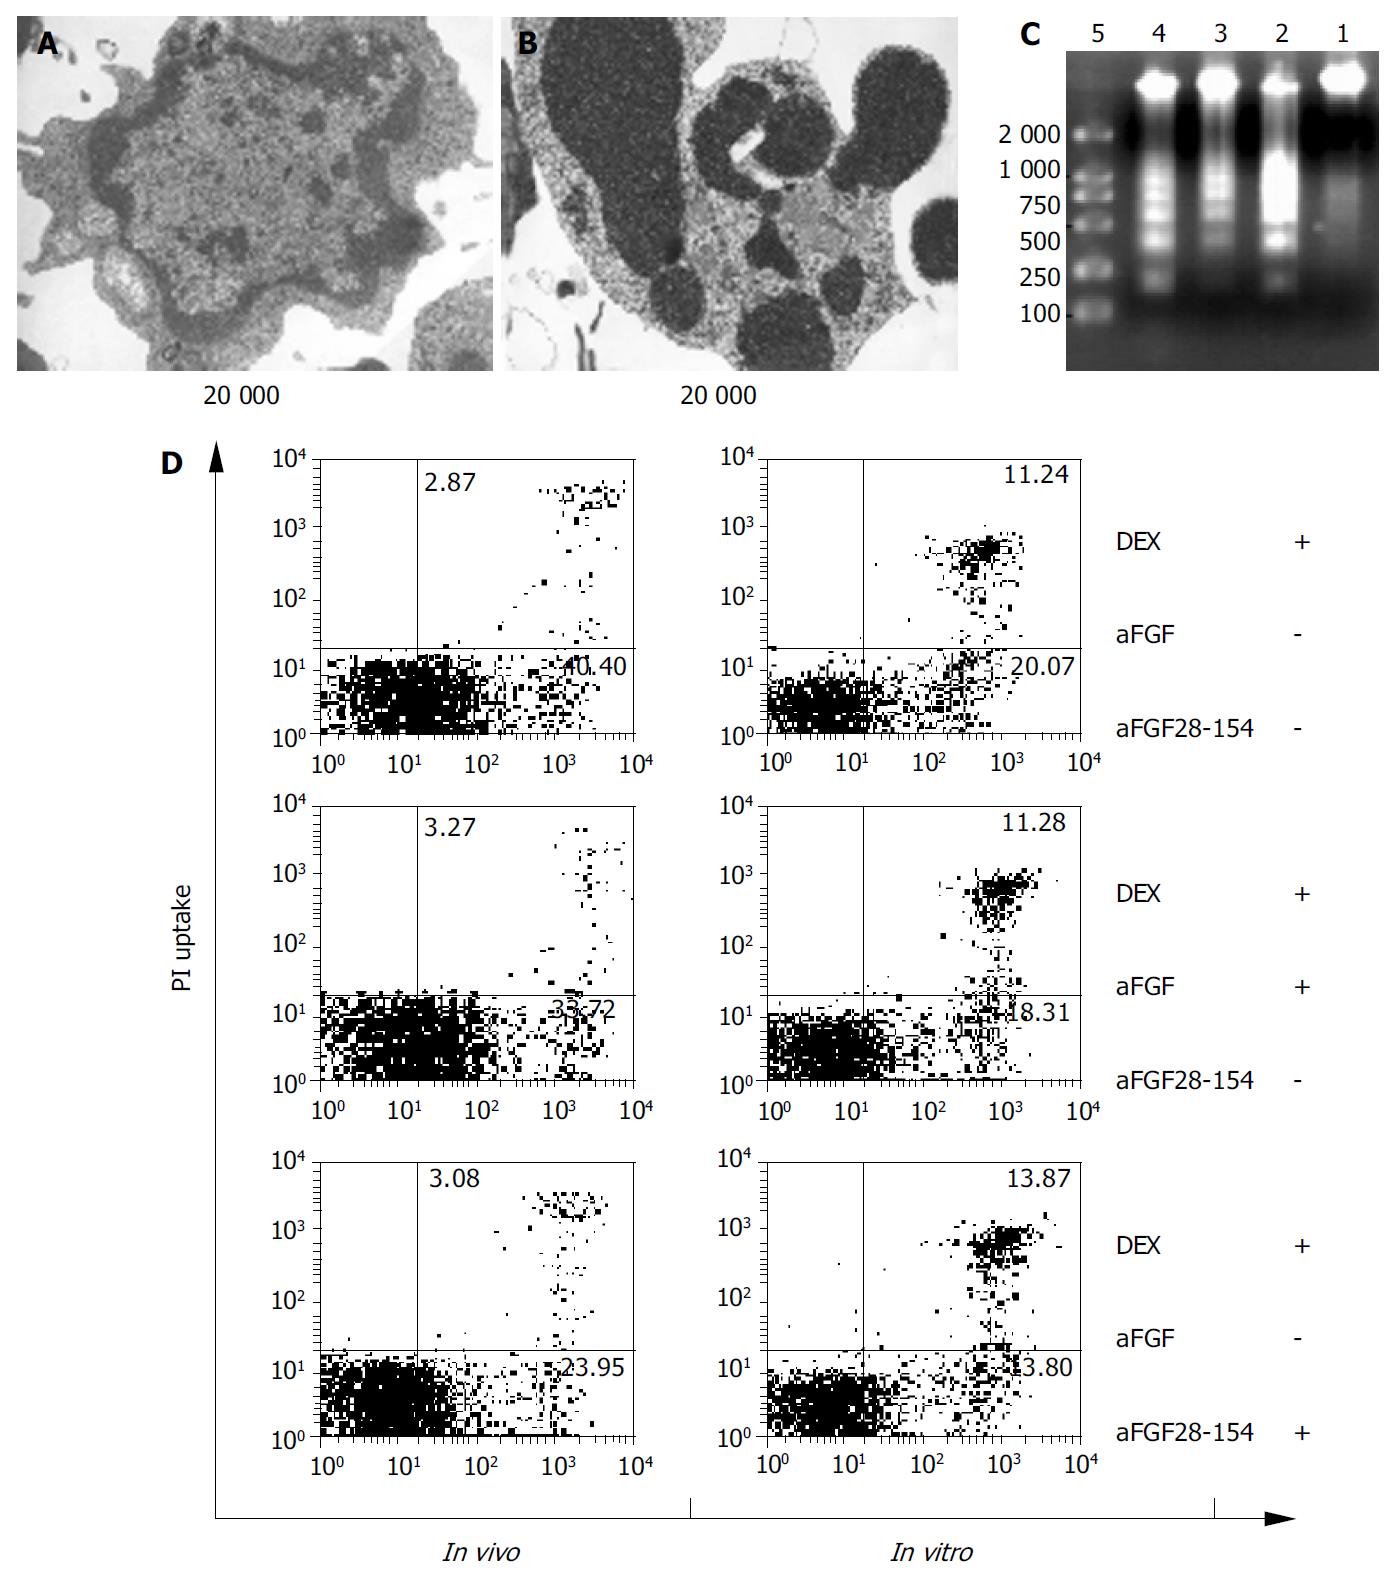
Figure 2 Comparative evaluation of the anti-apoptotic function of aFGF28-154 both in vitro and in vivo.
A: TEM observation (× 20000) of DEX-induced apoptosis in mouse thymocytes. B: Typical apoptotic bodies in DEX-induced thymocytes. C: Damage of DNA analysis by agarose gel electrophoresis according to DNA ladder kit (Apoptosis DNA Laddering Kit-Ethidium Bromide, R&D Systems). Lane 1: DNA extracted from normal control group; lane 2: DNA from DEX only group; lane 3: DNA from DEX plus aFGF28-154 group; lane 4: DNA from DEX plus aFGF group; lane 5: DNA size markers (bp). D: Flow cytometry results.
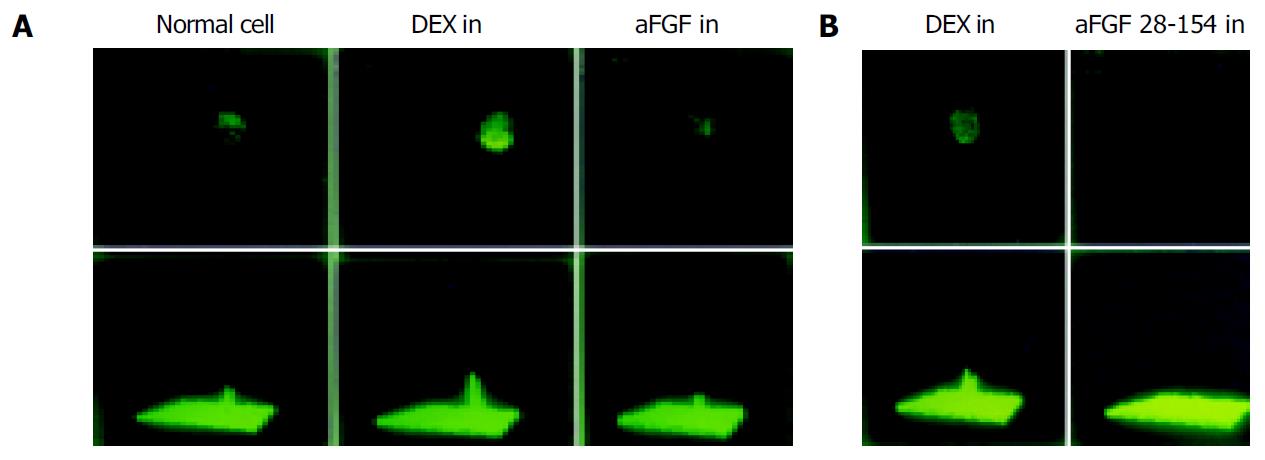
Figure 3 Balance of cytosolic calcium ion concentration protected by both aFGFs when stimulated by DEX.
A: Mouse thymoytes from Ca2+ influx protected by wild type aFGF. B: Decrease of intracellular Ca2+ concentration caused by aFGF28-154.
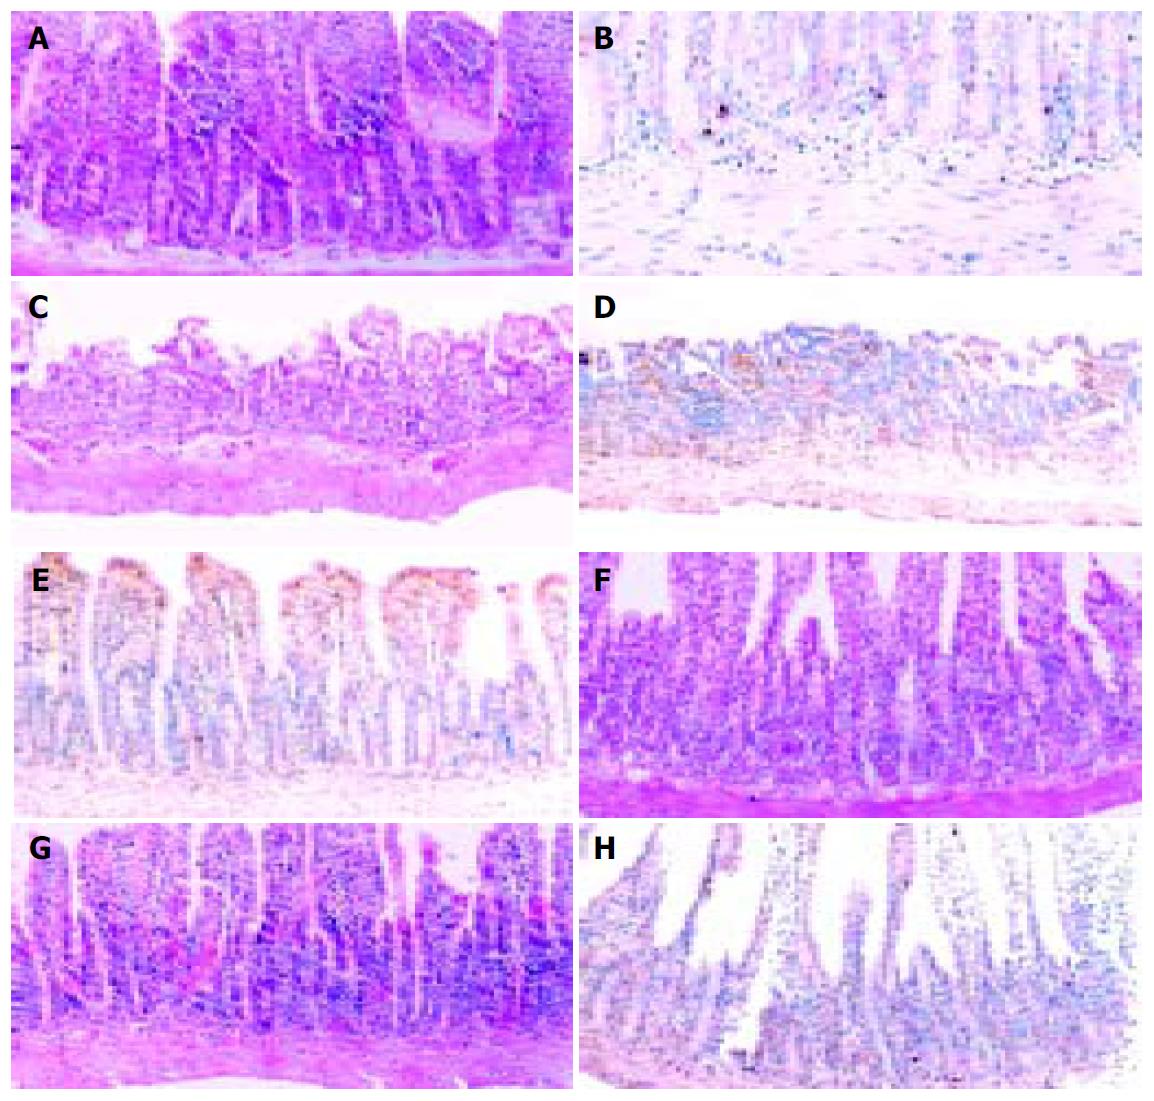
Figure 4 Morphological examination and immunohistochemical detection and quantification of apoptosis based on the label-ling of DNA strand breaks (Roche Applied Science, Germany).
A: Marked epithelial separation from the basement, subepithelial edema, haemorrhage, erosion. C: Necrosis in I/R plus saline control group. E and G: Tissue damage reduction in both aFGF and aFGF28-154 treated groups. B: Immunohistochemical detection and quantification of apoptosis in normal epithelium entericum. D: Increased number of apoptotic cells in epithelium entericum in rats treated with saline. F and H: Significant reduction of apoptotic cells in epithelium entericum in rats treated with both aFGF and aFGF28-154.
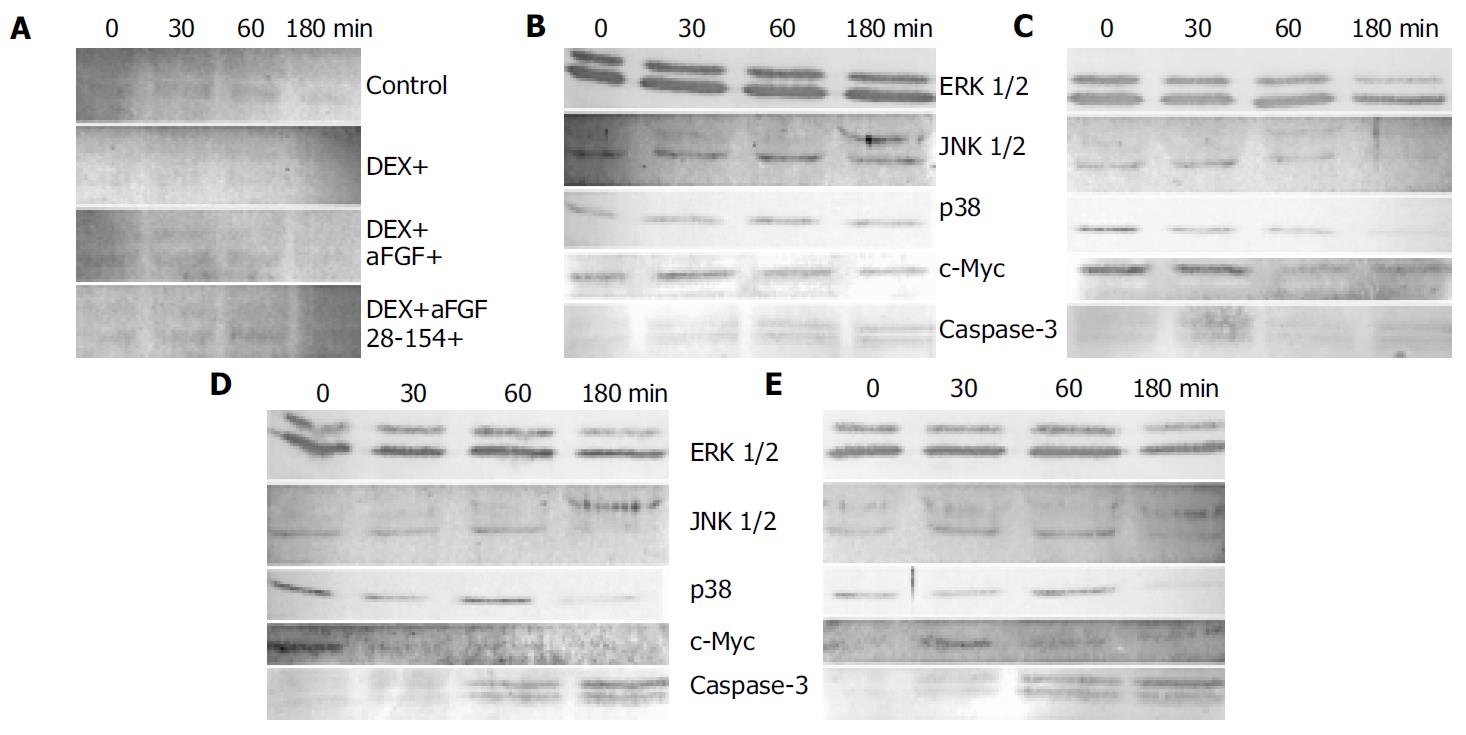
Figure 5 Function of aFGFs as a checker of cell cycle.
A: Western blot analysis of the phosphorylation of ERK1/2. B: Western blot analysis of ERK1/2 MAPK, JNK1/2 and p38 MAPK, as well as c-Myc and Caspase-3 in control group. C: Analysis of thymocytes stimulated by DEX. D: Analysis of thymocytes under aFGF protection. E: Analysis of thymocytes under aFGF28-154 protection.
- Citation: Fu XB, Li XK, Wang T, Cheng B, Sheng ZY. Enhanced anti-apoptosis and gut epithelium protection function of acidic fibroblast growth factor after cancelling of its mitogenic activity. World J Gastroenterol 2004; 10(24): 3590-3596
- URL: https://www.wjgnet.com/1007-9327/full/v10/i24/3590.htm
- DOI: https://dx.doi.org/10.3748/wjg.v10.i24.3590


