Copyright
©The Author(s) 2004.
World J Gastroenterol. Dec 1, 2004; 10(23): 3518-3521
Published online Dec 1, 2004. doi: 10.3748/wjg.v10.i23.3518
Published online Dec 1, 2004. doi: 10.3748/wjg.v10.i23.3518
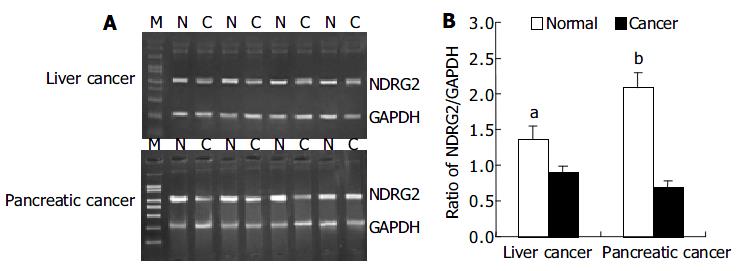
Figure 1 Expressions of NDRG2 mRNA in human liver cancer and pancreatic cancer.
A: Representative agarose gels of RT-PCR-amplified NDRG2. M: DNA molecular weight marker; N: Normal tissue; C: Cancer tissue; B: Relative amount of NDRG2 mRNA was evaluated by the ratio of band optical density of NDRG2/GAPDH and the expression was significantly decreased in cancer (n = 29 for liver cancer, and 8 for pancreatic cancer respectively) vs normal tissues. aP<0.05, bP < 0.01 vs normal.
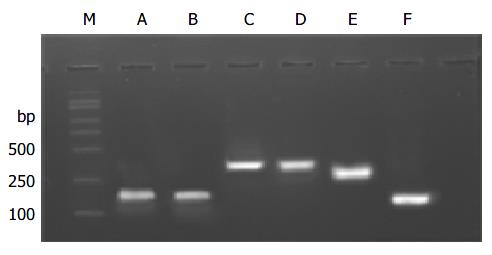
Figure 2 Agarose gel analysis of PCR products amplified by 6 pairs of primers covering the whole coding region of NDRG2.
M: DNA molecular weight marker, PCR product size was 186 bp for A, 188 bp for B, 365 bp for C, 364 bp for D, 286 bp for E and 153 bp for F.
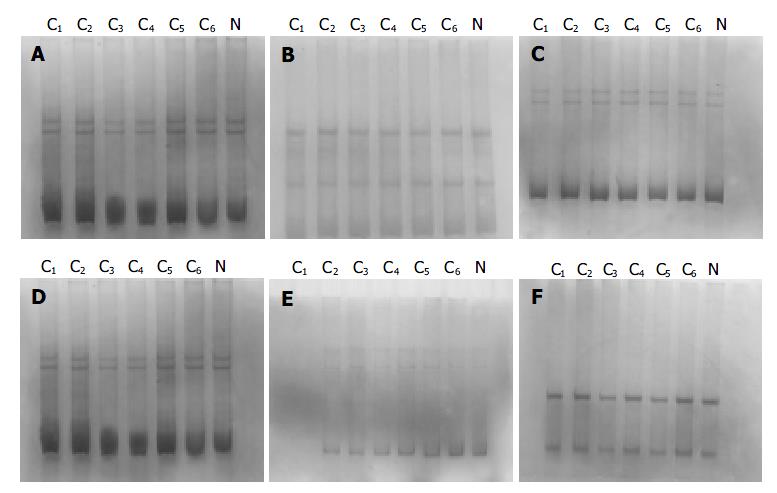
Figure 3 Representative results of SSCP silver staining of the PCR products (186 bp for A, 188 bp for B, 365 bp for C, 364 bp for D, 286 bp for E, and 153 bp for F) amplified by 6 pairs of primers covering the whole coding region of NDRG2.
C: cancer tissue; N: normal tissue.
- Citation: Hu XL, Liu XP, Lin SX, Deng YC, Liu N, Li X, Yao LB. NDRG2 expression and mutation in human liver and pancreatic cancers. World J Gastroenterol 2004; 10(23): 3518-3521
- URL: https://www.wjgnet.com/1007-9327/full/v10/i23/3518.htm
- DOI: https://dx.doi.org/10.3748/wjg.v10.i23.3518


