Copyright
©The Author(s) 2004.
World J Gastroenterol. Dec 1, 2004; 10(23): 3485-3489
Published online Dec 1, 2004. doi: 10.3748/wjg.v10.i23.3485
Published online Dec 1, 2004. doi: 10.3748/wjg.v10.i23.3485
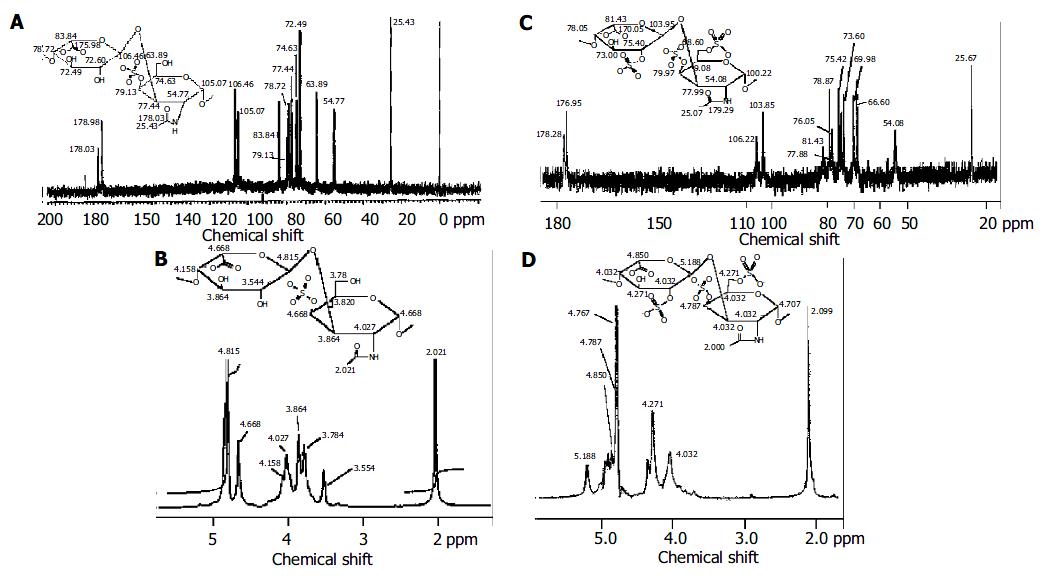
Figure 1 1H-NMR and 13C-MNR spectra of DS and PSDS.
A and B: 13C-MNR and 1H-NMR spectra of DS and the chemical shift of major disaccharides in DS; C and D: 13C-MNR and 1H-NMR spectra of PSDS and the chemical shift of the major disaccharides in PSDS.
Figure 2 Fragment size separation of DS-Oligs.
The products were separated on a Superdex 30 size exclusion column (26 mm × 1200 mm) at a flow rate of 0.5 mL/min in 0.25 mol/L ammonium bicarbonate. Elution profiles were monitored by carbazole assay. A and B: depolymerized products of DS and PSDS.
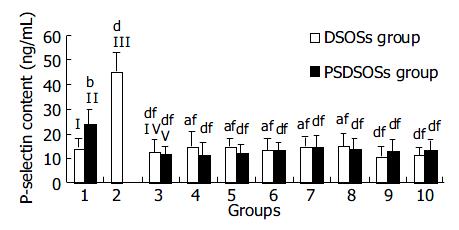
Figure 3 Effects of DS derivatives on expression of P-selectin on IP surface.
Bars I, II, III, IV and V represent control group, IBD control group, ADP group, DS group and PSDS group, respectively. Groups 4 to 10 represent DS-Oligs from 1 to 7 listed in Table 1. bP < 0.01 vs control group; aP < 0.05, dP < 0.01 vs IBD control group; fP < 0.01 vs ADP group (n = 10 for each group).
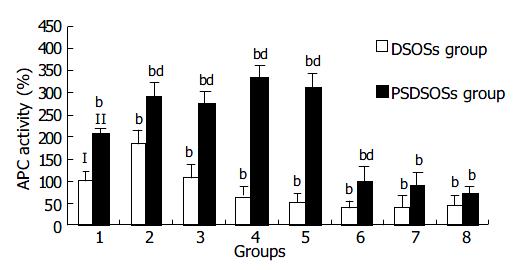
Figure 4 Effects of DS and its derivatives on APC activity.
Bars I and II represent DS group and PSDS group, respectively. Groups 2 to 8 represent DS-Oligs from 1 to 7 listed in Table 1. bP < 0.01 vs DS group, dP < 0.01 vs PSDS group (n = 10 for each group).
- Citation: Ji SL, Du HY, Chi YQ, Cui HF, Cao JC, Geng MY, Guan HS. Effects of dermatan sulfate derivatives on platelet surface P-selectin expression and protein C activity in blood of inflammatory bowel disease patients. World J Gastroenterol 2004; 10(23): 3485-3489
- URL: https://www.wjgnet.com/1007-9327/full/v10/i23/3485.htm
- DOI: https://dx.doi.org/10.3748/wjg.v10.i23.3485


