Copyright
©The Author(s) 2004.
World J Gastroenterol. Dec 1, 2004; 10(23): 3455-3458
Published online Dec 1, 2004. doi: 10.3748/wjg.v10.i23.3455
Published online Dec 1, 2004. doi: 10.3748/wjg.v10.i23.3455
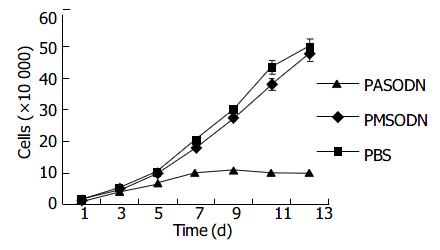
Figure 1 Curve of cell growth with time.
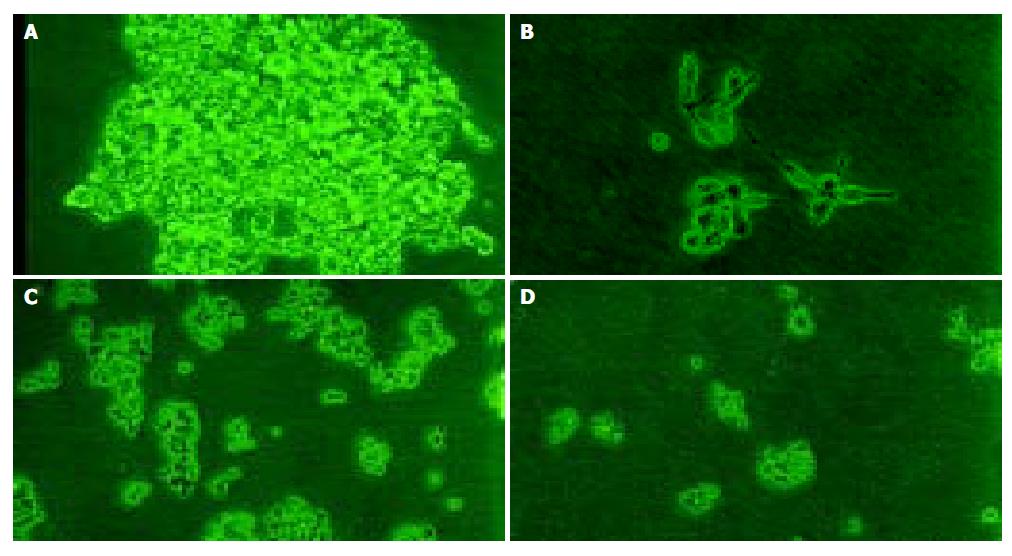
Figure 2 Changes in cell morphology and distribution.
A: PMSODN group (10 × 40); B: PASODN group (10 × 40); C: PMSODN group (10 × 10); D: PASODN group (10 × 10).
Figure 3 Cell cycle after 72 h of treatment with PASODN(A) and PMSODN(B) detected by FCM.
- Citation: Wang XS, Wang K, Li X, Fu SB. Effects of phosphorothioate anti-sense oligodeoxynucleotides on colorectal cancer cell growth and telomerase activity. World J Gastroenterol 2004; 10(23): 3455-3458
- URL: https://www.wjgnet.com/1007-9327/full/v10/i23/3455.htm
- DOI: https://dx.doi.org/10.3748/wjg.v10.i23.3455


