Copyright
©The Author(s) 2004.
World J Gastroenterol. Dec 1, 2004; 10(23): 3433-3440
Published online Dec 1, 2004. doi: 10.3748/wjg.v10.i23.3433
Published online Dec 1, 2004. doi: 10.3748/wjg.v10.i23.3433
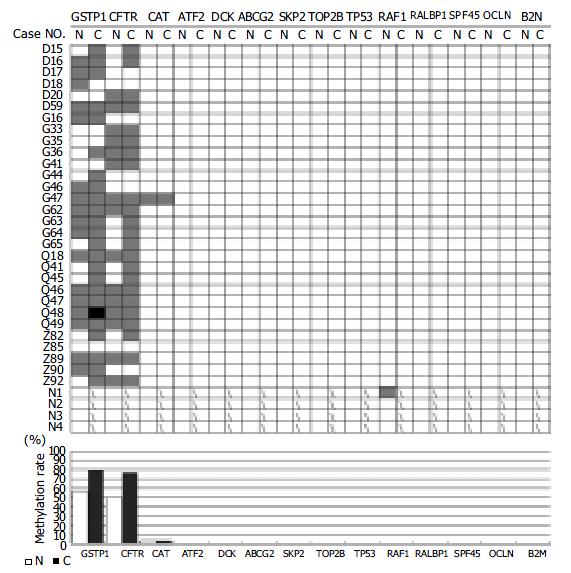
Figure 1 The hypermethylation for each gene in each of HCC patient samples
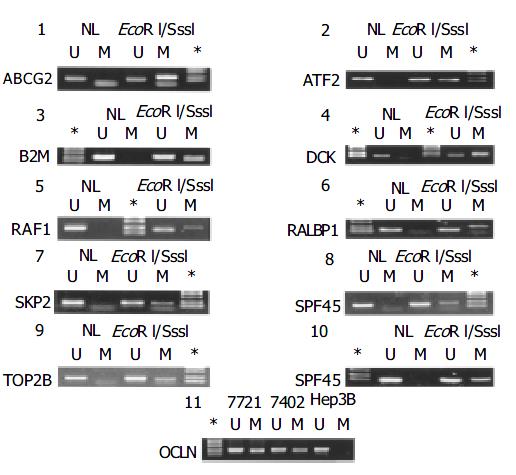
Figure 2 MSP testing with the M.
Sss I treated normal liver tissue DNA. The in vitro methylated DNA from the normal liver tissue was used for MSP along with the untreated. Panels: 1, ABCG2; 2, ATF2; 3, B2M; 4, DCK; 5, RAF1; 6, RALBP1; 7, SKP2; 8, SPF45; 9, TOP2b; and 10, TP53. The PCR conditions for OCLN gene were assessed by PCR in three liver cancer cell lines, 7721, 7402, and Hep3B (panel 11). U, unmethylated allele; M, methylated allele, NL, normal liver tissue; *the DNA size marker: DL-2000.
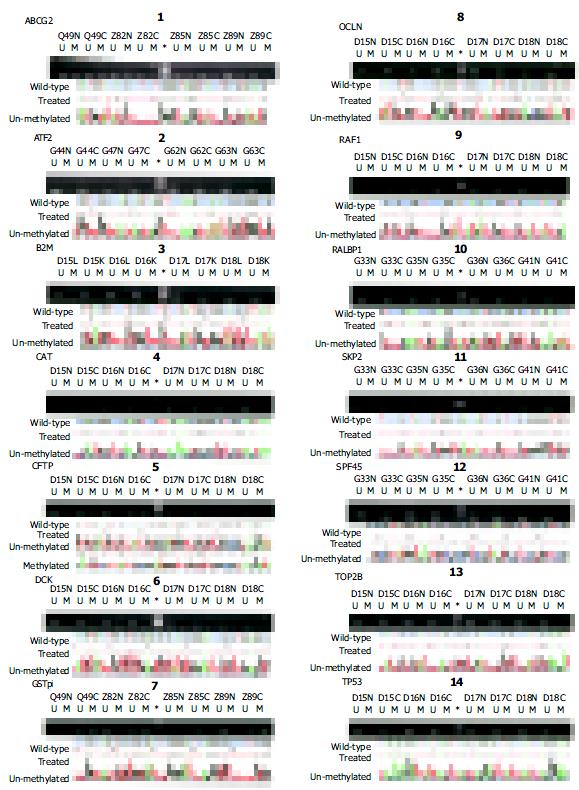
Figure 3 Methylation profiles of the promoter CpG islands of 24 genes in HCC.
Both electrophoretic patterns of the representative PCR products of each of 14 targets and the sequencing verification of one representative PCR product were presented. To indicate the methylation status, the sequenced data are aligned with the wild-type sequence. *, size markers, the bands of 250 bp and 100 bp were shown. U, unmethylated; and M, the hypermethylated. Panels: 1, ABCG2; 2, ATF2; 3, B2M; 4, CAT; 5, CFTR; 6, DCK; 7,GSTpi; 8, OCLN; 9, RAF1; 10,RALBP1; 11, SKP2; 12, SPF45; 13, TOP2B; and 14, TP53.
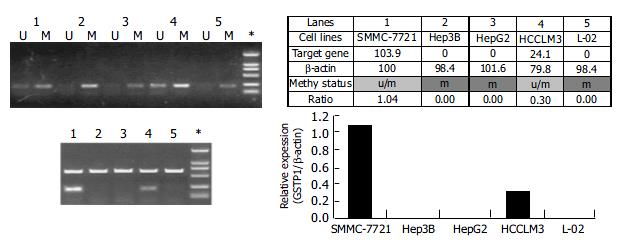
Figure 4 Methylation status of the promoter CpG Island correlated the expression state of the GSTpi gene in liver cancer cell lines.
Both methylation status (panel 1) and mRNA level (panel 2) of the GSTpi gene in SMMC-7721 (lane 1), Hep3B (lane 2), HepG2 (Lane 3), HCCLM3 (lane 4) are determined and presented. *, size markers, the bands of 250 bp and 100 bp are shown. U, unmethylated; and M, the hypermethylated. The density of the bands (indicated in panel 3) for the intemal control β -actin and the GSTpi gene were densitometrically recorded, where the density of the β -actin in SMMC-7721 cells was arbitrarily taken as 100%. The band-ratio of the GSTpi over the β -actin genes were calculated and summarized in the table and plot (panel 3).
- Citation: Ding S, Gong BD, Yu J, Gu J, Zhang HY, Shang ZB, Fei Q, Wang P, Zhu JD. Methylation profile of the promoter CpG islands of 14 “drug-resistance” genes in hepatocellular carcinoma. World J Gastroenterol 2004; 10(23): 3433-3440
- URL: https://www.wjgnet.com/1007-9327/full/v10/i23/3433.htm
- DOI: https://dx.doi.org/10.3748/wjg.v10.i23.3433


