Copyright
©The Author(s) 2004.
World J Gastroenterol. Nov 1, 2004; 10(21): 3230-3233
Published online Nov 1, 2004. doi: 10.3748/wjg.v10.i21.3230
Published online Nov 1, 2004. doi: 10.3748/wjg.v10.i21.3230
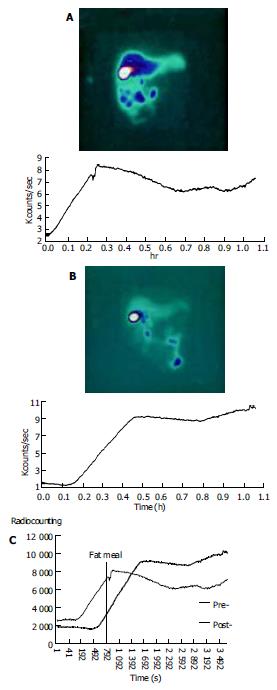
Figure 1 Time-activity curves of gallbladder in cirrhotic pa-tients before ( A) and after portal azygous disconnection (B) as well as their comparison (C).
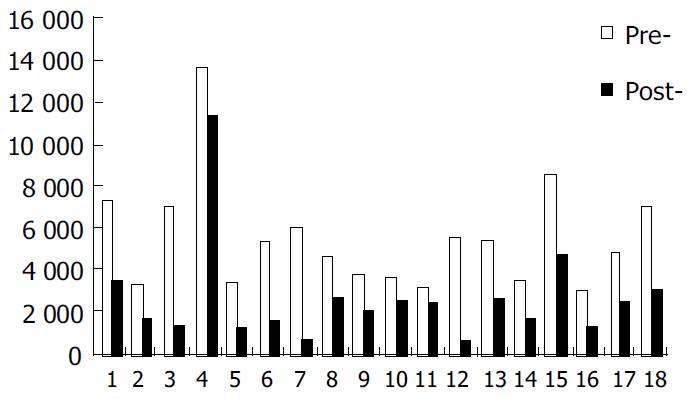
Figure 2 RC 30 min of gallbladder in pre-PAD and post-PAD.
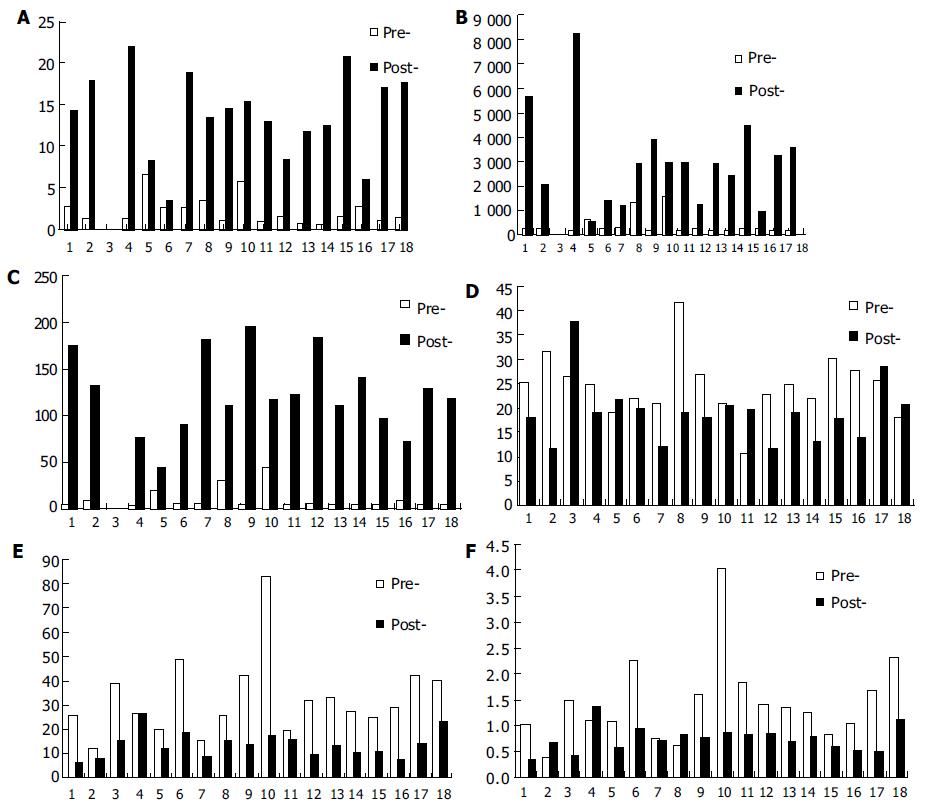
Figure 3 After administration of fat meal, changes in some parameters of gallbladder contraction.
A: LP, B: LI, C: LR, D: EP, E: EF and F: ER.
- Citation: Jin HX, Wu SD, Zhang XF, Chen XY, Zhang GX. Gallbladder motility in patients with hepatic cirrhosis before and after portal azygous disconnection. World J Gastroenterol 2004; 10(21): 3230-3233
- URL: https://www.wjgnet.com/1007-9327/full/v10/i21/3230.htm
- DOI: https://dx.doi.org/10.3748/wjg.v10.i21.3230


