Copyright
©The Author(s) 2004.
World J Gastroenterol. Nov 1, 2004; 10(21): 3208-3211
Published online Nov 1, 2004. doi: 10.3748/wjg.v10.i21.3208
Published online Nov 1, 2004. doi: 10.3748/wjg.v10.i21.3208
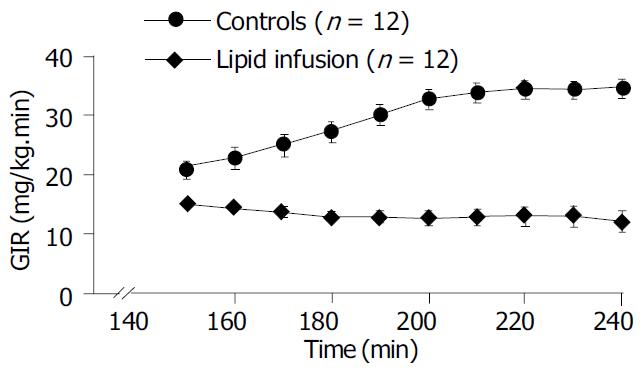
Figure 1 Time course of glucose infusion rate during hyperin-sulinemic euglycemic clamping.
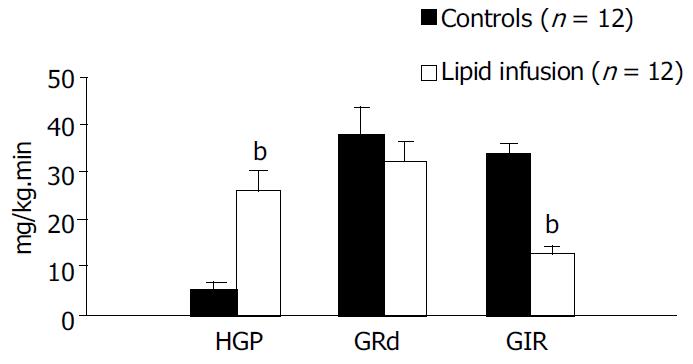
Figure 2 Steady-state hepatic glucose production, glucose dis-appearance rate, glucose infusion rate during hyperinsulinaemic-euglycaemic clamp studies in control and lipid-infused rats.
bP < 0.01, vs control.
- Citation: Li L, Yang GY. Effect of hepatic glucose production on acute insulin resistance induced by lipid-infusion in awake rats. World J Gastroenterol 2004; 10(21): 3208-3211
- URL: https://www.wjgnet.com/1007-9327/full/v10/i21/3208.htm
- DOI: https://dx.doi.org/10.3748/wjg.v10.i21.3208


