Copyright
©The Author(s) 2004.
World J Gastroenterol. Nov 1, 2004; 10(21): 3157-3160
Published online Nov 1, 2004. doi: 10.3748/wjg.v10.i21.3157
Published online Nov 1, 2004. doi: 10.3748/wjg.v10.i21.3157
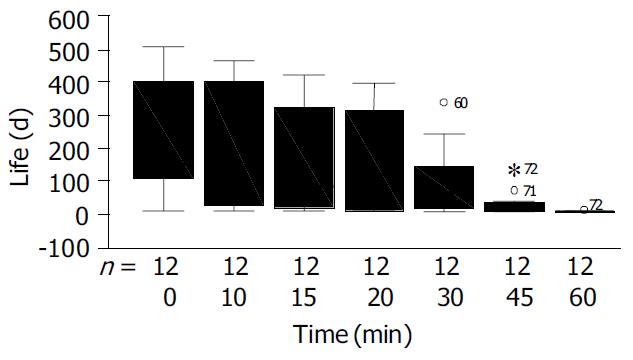
Figure 1 Statistical analysis of survival time.
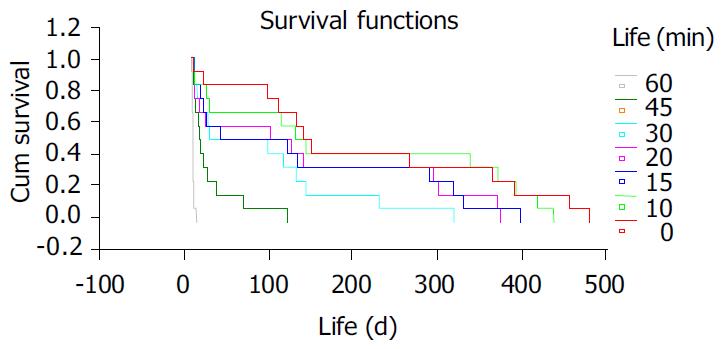
Figure 2 Survival curve (Kaplan-Meier method).
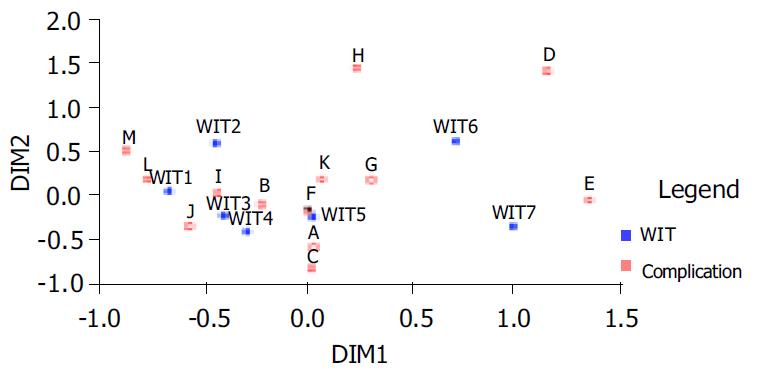
Figure 3 Relationship between WIT and complications (correspondence analysis).
WIT 1, 2, 3, 4, 5, 6 and 7 represent WIT 0 min, 10 min, 15 min, 20 min, 30 min, 45 min and 60 min, respectively. A: Hemorrhage; B: SVC (superior vena cava) thrombosis; C: IVC (inferior vena cava) thrombosis; D: PV (portal vein) thrombosis; E: Liver dysfunction; F: Pulmonary infection; G: Abdominal infection; H: Bile leakage; I: Bile obstruction; J: Adhesive intestinal obstruction; K: Liver abscess; L: Unexplained; M: Natural death.
- Citation: He XS, Ma Y, Wu LW, Ju WQ, Wu JL, Hu RD, Chen GH, Huang JF. Safe time to warm ischemia and posttransplant survival of liver graft from non-heart-beating donors. World J Gastroenterol 2004; 10(21): 3157-3160
- URL: https://www.wjgnet.com/1007-9327/full/v10/i21/3157.htm
- DOI: https://dx.doi.org/10.3748/wjg.v10.i21.3157


