Copyright
©The Author(s) 2004.
World J Gastroenterol. Nov 1, 2004; 10(21): 3151-3156
Published online Nov 1, 2004. doi: 10.3748/wjg.v10.i21.3151
Published online Nov 1, 2004. doi: 10.3748/wjg.v10.i21.3151
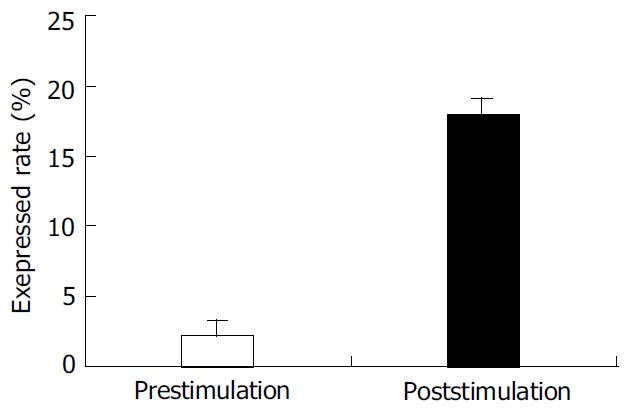
Figure 1 Peripheral blood mononuclear cells isolated from healthy individuals using Ficoll and co-cultured with PHA for 8 h at 37 °C in humidified atmosphere containing 50 mL/L CO2.
The expression of FasL on PBL before and after PHA stimulation was detected by special antibody using flow cytometer. Open bar indicates the percent of FasL on cells surface before PHA activation. Shadow bar shows the percent of FasL on cell surface after PHA stimulation.
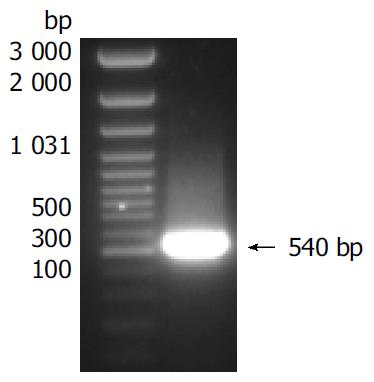
Figure 2 Reversion of total RNA isolated from PHA activated peripheral blood mononuclear cells to cDNA.
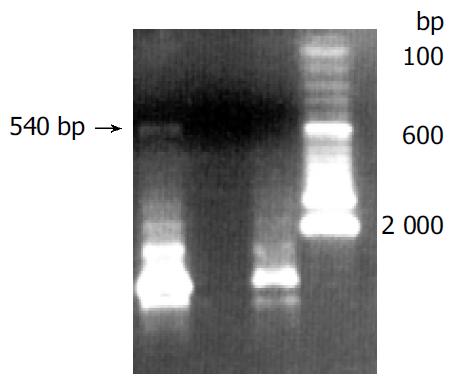
Figure 3 PCR bands and transfected DH 5a.
Band1: Inserted fragment of sFasL in pQE-31; Band 2: No inserted fragment.
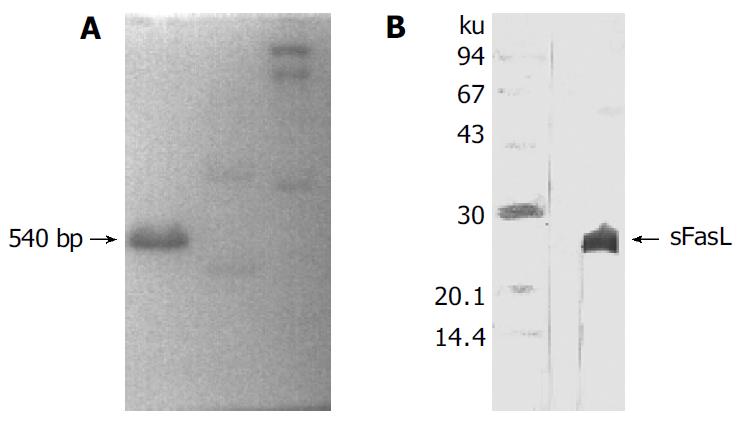
Figure 4 sFasL expression in SDS-gel (A) and hybridization with special anti-sFasL antibody (B).
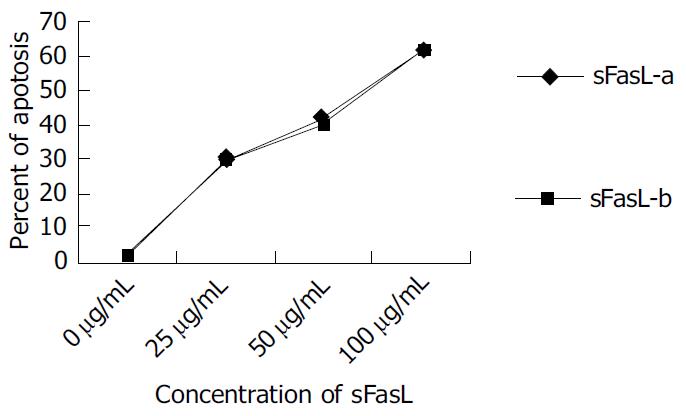
Figure 5 Cell apoptosis induced by different doses of sFasL (25, 50 and 100 μg/L).
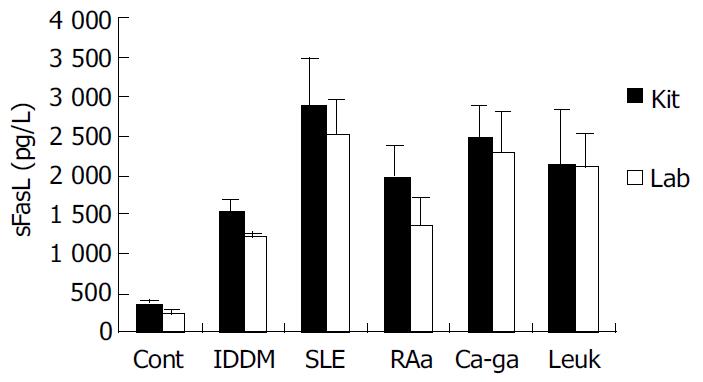
Figure 6 Levels of soluble FasL in serum from patients with different diseases.
Cont: Serum from healthy individuals; IDDM: Serum from patients with IDDM; SLE: Serum from IDDM; RAa: Serum from RA patients with activated stage; Ca-ga: Serum from patients with gastric cancer; Leuk: Serum from patients with leukemia; Shadow bar: Serum level detected by commer-cial sFasL kit. Open bar: Serum level detected by anti-sFasL antibody.
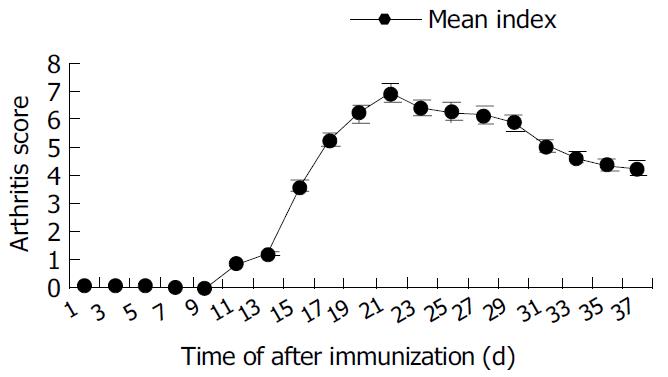
Figure 7 Mean arthritis score of rats with CIA.
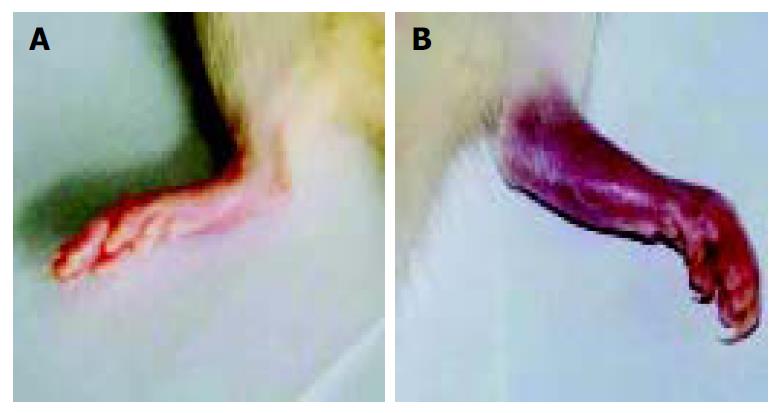
Figure 8 Ankylosis in arthritis rats.
A: Ankylosis induced by sFasL in arthritis rats. B: Grade 4 inflammation in rat hind paw.
- Citation: Li NL, Nie H, Yu QW, Zhang JY, Ma AL, Shen BH, Wang L, Bai J, Chen XH, Zhou T, Zhang DQ. Role of soluble Fas ligand in autoimmune diseases. World J Gastroenterol 2004; 10(21): 3151-3156
- URL: https://www.wjgnet.com/1007-9327/full/v10/i21/3151.htm
- DOI: https://dx.doi.org/10.3748/wjg.v10.i21.3151


