Copyright
©The Author(s) 2004.
World J Gastroenterol. Nov 1, 2004; 10(21): 3137-3140
Published online Nov 1, 2004. doi: 10.3748/wjg.v10.i21.3137
Published online Nov 1, 2004. doi: 10.3748/wjg.v10.i21.3137
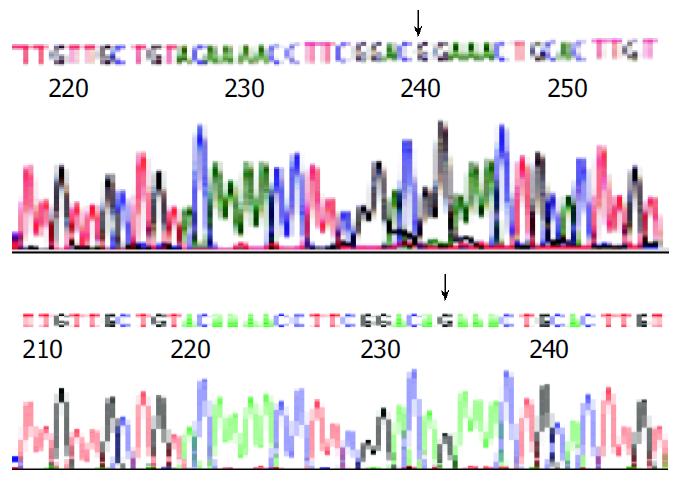
Figure 1 Partial sequences of plasmids pCMV-S.
S2 and pCMV-S.S2+145R A: “↓”± stands for the “G” in gene sequences of pCMV-S.S2 B: “↓”± stands for the “A” in gene sequences of pCMV-S.S2+145R, namely mutant point.
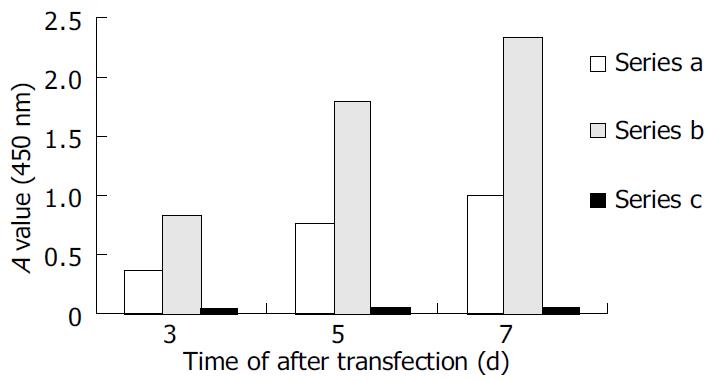
Figure 2 Secretion of HBsAg in vitro.
Series A: HBsAg levels of supernatant collected from pCMV-S.S2 + 145R-transfected cells. Series B: HBsAg levels of supernatant collected from pCMV-S.S2-transfected cells. Series C: Negative control.
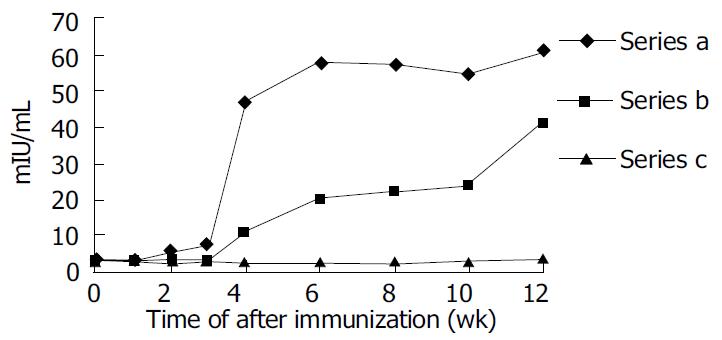
Figure 3 Humoral immune response induced by DNA-based immunization.
Series A: Anti-HBs level in pCMV-S.S2-immunized mice. Series B: Anti-HBs level in pCMV-S.S2 + 145R-immunized mice. Series C: Anit-HBs level in pcDNA3.0-immunized mice.
Figure 4 Comparison of humoral immune responses to preS2 anigen and HBsAg.
A: Comparison of humoral immune responses to preS2 anigen. Series a: Anti-preS2 level in pCMV-S.S2-immunized mice. Series b: Anti-preS2 level in pCMV-S.S2 + 145R - immunized mice. Series c: Negative control. B: Comparison of humoral immune responses to HBsAg. Series a: pCMV-S.S2 - immunized mice. Series b: pCMV-S.S2 + 145R-immunized mice. Series c: Negative control.
-
Citation: Ge JH, Liu HM, Sun J, Zhang LZ, He J, Li YL, Liu H, Xu Y, Yu HY, Hu YP. Antigenic and immunogenic changes due to mutation of
s gene of HBV. World J Gastroenterol 2004; 10(21): 3137-3140 - URL: https://www.wjgnet.com/1007-9327/full/v10/i21/3137.htm
- DOI: https://dx.doi.org/10.3748/wjg.v10.i21.3137


