Copyright
©The Author(s) 2004.
World J Gastroenterol. Nov 1, 2004; 10(21): 3127-3131
Published online Nov 1, 2004. doi: 10.3748/wjg.v10.i21.3127
Published online Nov 1, 2004. doi: 10.3748/wjg.v10.i21.3127
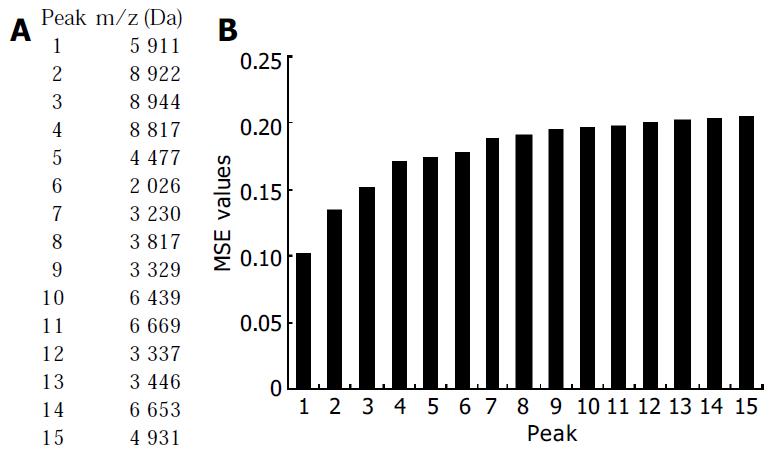
Figure 1 MSE values of the top 15 peaks.
A: m/z of peaks. B: MSE values of peaks.
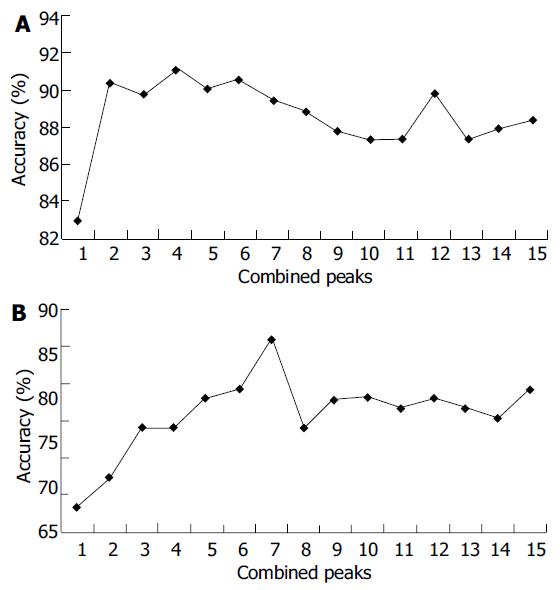
Figure 2 Accuracies of different combinations of peaks.
A: Accuracies of different combinations of peaks in the pattern discriminating CRC patients from HP. B: Accuracies of differ-ent combinations of peaks in the pattern discriminating CRC patients from CRA patients.
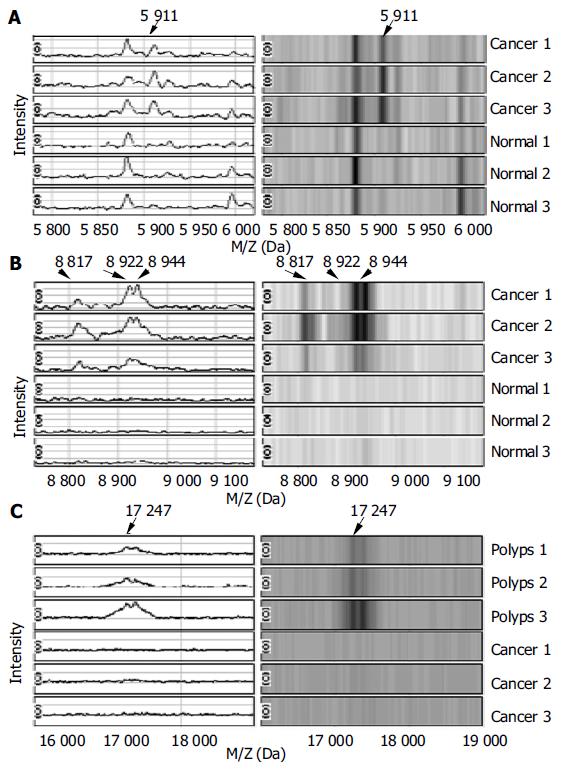
Figure 3 Spectra and gel maps of potential biomarkers.
A: Spectra and gel maps of the peak with the m/z of 5 911 Da. B: Spectra and gel maps of the peak with the m/z of 8 922, 8 944, 8 817 Da. C: Spectra and gel maps of the peak with the m/z of 17 247 Da.
- Citation: Yu JK, Chen YD, Zheng S. An integrated approach to the detection of colorectal cancer utilizing proteomics and bioinformatics. World J Gastroenterol 2004; 10(21): 3127-3131
- URL: https://www.wjgnet.com/1007-9327/full/v10/i21/3127.htm
- DOI: https://dx.doi.org/10.3748/wjg.v10.i21.3127


