Copyright
©The Author(s) 2004.
World J Gastroenterol. Nov 1, 2004; 10(21): 3112-3117
Published online Nov 1, 2004. doi: 10.3748/wjg.v10.i21.3112
Published online Nov 1, 2004. doi: 10.3748/wjg.v10.i21.3112
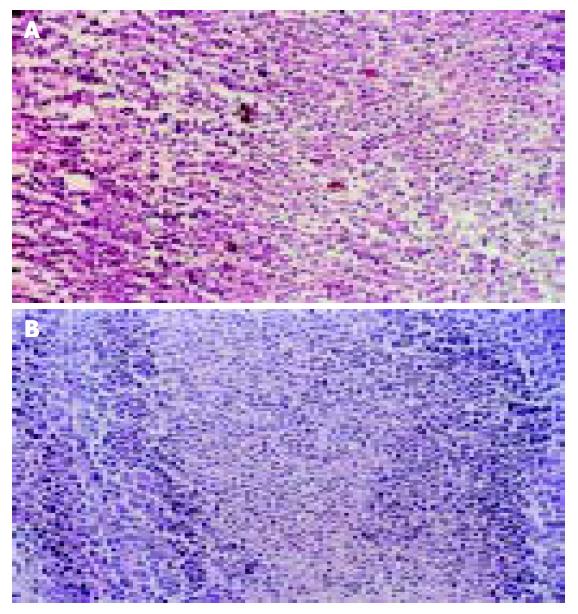
Figure 1 Coagulation necrosis in the center to periphery of the tumors of QESI after injection.
(A, HE × 10). The center of the tumor of SELI appeared coagulation necrosis, but in the periphery cancer cells grew luxuriantly after injection (B, HE × 10).
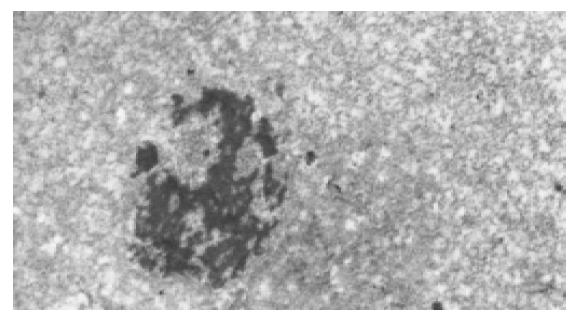
Figure 2 Inflammation cell infiltration (A) and faciculus (B) in the periphery of tumors of SQLI group.
electron microscope examination.
Figure 3 Degeneration cancer cells (A) and fasciculus (B) in the periphery of the tumors of QELI.
Shown in electron microscope examination after injection.
Figure 4 Necrosis changes such as karyalysis, karyorrhexis and cell membrane disappearance in the tumors of QESI after injection under election microscope.
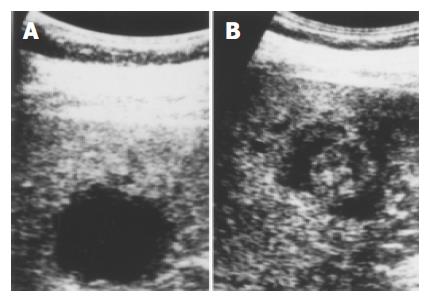
Figure 5 Reduction of the average diameter of HCC nodules from 3.
6 cm (before injection, A) to 2.6 cm (two years after injection, B) and hyperechogenic rings in the periphery with haloes surrounding them after injection.
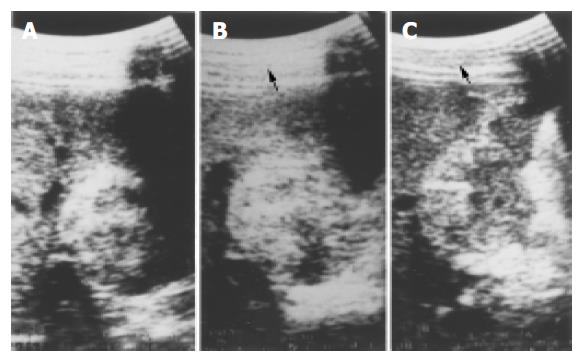
Figure 6 A: Average diameter of HCC nodule was 4.
4 cm. B: It was 4.8 cm after 10 injections of absolute ethanol and the echogenic enhanced. C:After 42 mo of therapy the tumor shrank to 2.9 cm in diameter and formed facula.
- Citation: Lin LW, Lin XY, He YM, Gao SD, Xue ES, Lin XD, Yu LY. Experimental and clinical assessment of percutaneous hepatic quantified ethanol injection in treatment of hepatic carcinoma. World J Gastroenterol 2004; 10(21): 3112-3117
- URL: https://www.wjgnet.com/1007-9327/full/v10/i21/3112.htm
- DOI: https://dx.doi.org/10.3748/wjg.v10.i21.3112


