Copyright
©The Author(s) 2004.
World J Gastroenterol. Jan 15, 2004; 10(2): 250-254
Published online Jan 15, 2004. doi: 10.3748/wjg.v10.i2.250
Published online Jan 15, 2004. doi: 10.3748/wjg.v10.i2.250
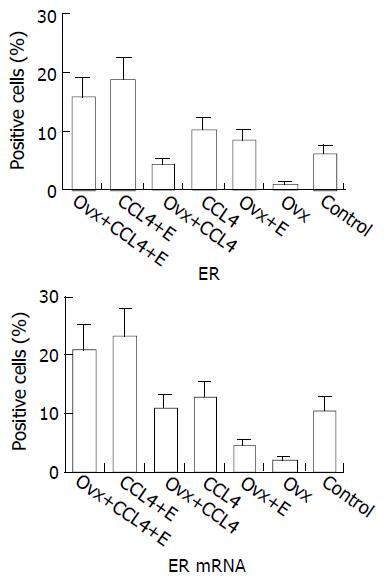
Figure 1 ERα and ERα mRNA in female rat liver.
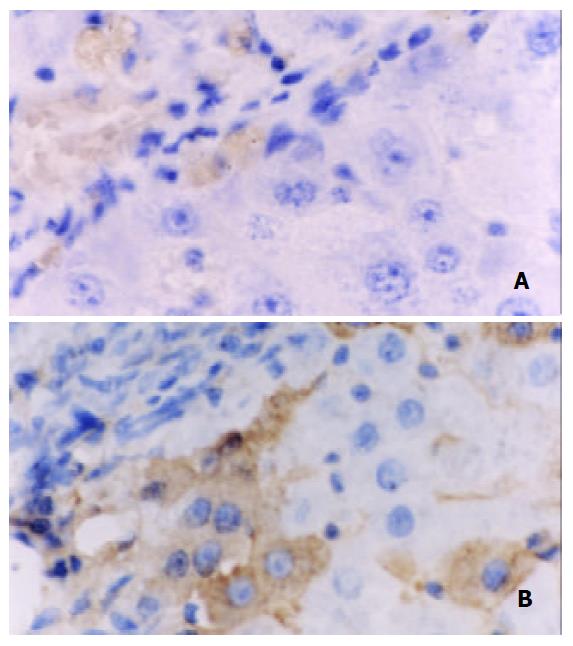
Figure 2 Positive signal of ER in female rat liver (Immunohisto-chemistry staining PAP method, magnification ×400).
2A: CCl4 group, 2B: Estradiol treatment group shows increased ER ex-pression compared with 2A.
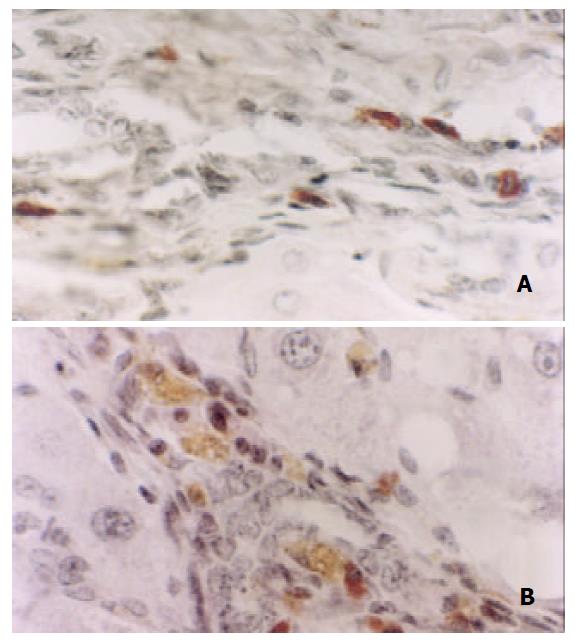
Figure 3 Positive signal of ER mRNA in female rat liver (in situ hybridization staining, SP method, magnification ×400).
3A: CCl4 group, 3B: Estradiol treatment group shows increased ER mRNA expression compared with 3A.
- Citation: Xu JW, Gong J, Chang XM, Luo JY, Dong L, Jia A, Xu GP. Effects of estradiol on liver estrogen receptor-α and its mRNA expression in hepatic fibrosis in rats. World J Gastroenterol 2004; 10(2): 250-254
- URL: https://www.wjgnet.com/1007-9327/full/v10/i2/250.htm
- DOI: https://dx.doi.org/10.3748/wjg.v10.i2.250


