Copyright
©The Author(s) 2004.
World J Gastroenterol. Jan 15, 2004; 10(2): 244-249
Published online Jan 15, 2004. doi: 10.3748/wjg.v10.i2.244
Published online Jan 15, 2004. doi: 10.3748/wjg.v10.i2.244
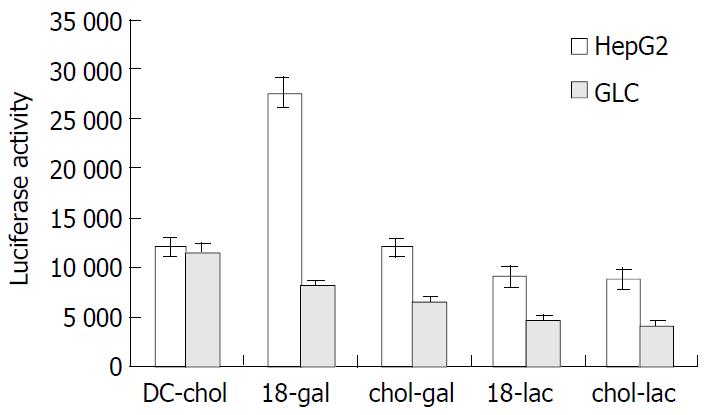
Figure 1 Transfection activity of plasmid DNA/liposome com-plexes in HepG2 cells and GLC cells.
Four types of targeting liposomes (18-gal, 18-lac, chol-gal and chol-lac) were prepared by mixing the targeting molecules with DC-chol/DOPE at a molar ratio of 1:6:4, respectively. A fixed amount (0.4 μg/well) of plasmid DNA was complexed with liposomes at a ratio of 1:5(wt/wt). Each value represents -x±s (n = 3).
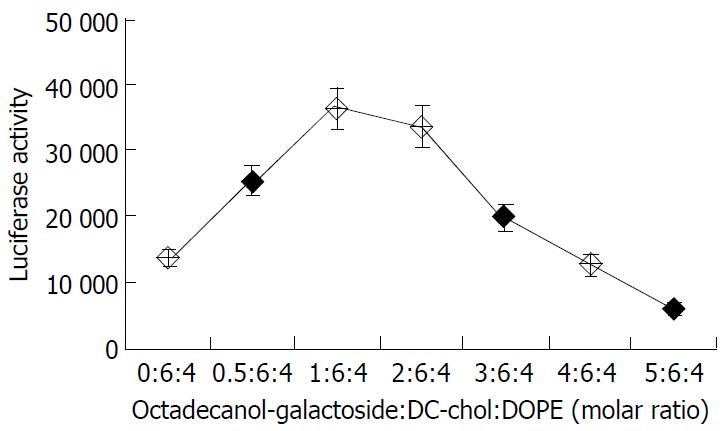
Figure 2 Effect on liposomal transfection activity in HepG2 cells of molar ratio of octadecanol-galactoside (targeting molecules) in liposome composition.
The molar ratio of octadecanol-galactoside to lipid DC-chol/DOPE varied from 0:6:4 to 5:6:4. A fixed amount (0.4 μg/well) of plasmid DNA was complexed with liposomes at a ratio of 1:5 (wt/wt). Each value represents -x±s (n = 3).
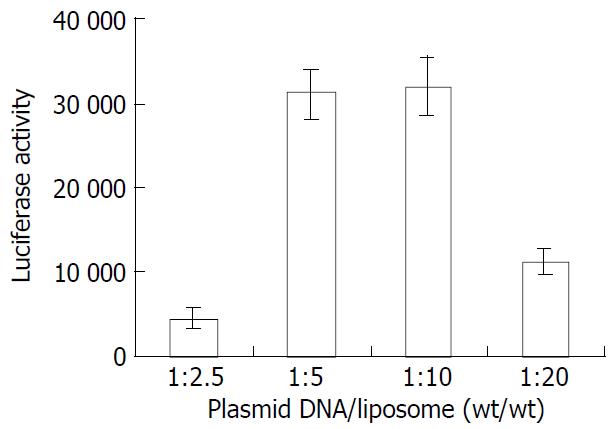
Figure 3 Transfection activity of plasmid DNA/liposome com-plexes at various ratios (wt/wt) in HepG2 cells.
Liposomal com-position was octadecanol-galactoside:DC-chol:DOPE 1:6:4 (molar ratio). Plasmid DNA amount was fixed at 0.4 μg/well in all experiments. Each value represents -x±s (n = 3).
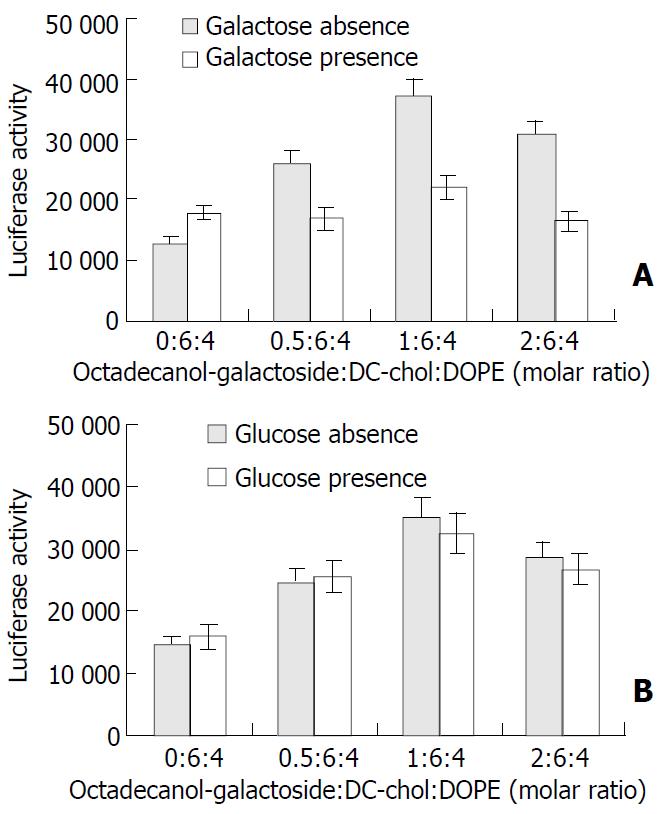
Figure 4 Effect of copresence of 20 mmol/L galactose (A) and glucose (B) on transfection activity of liposomes of different composition in HepG2 cells.
Cells were transfected with DNA/ liposome complexes in the presence (□) and absence (■) of galactose or glucose. A fixed amount (0.4 μg/well) of plasmid DNA was complexed with liposomes at a ratio of 1:5 (wt/wt). Each value represents -x±s (n = 3).
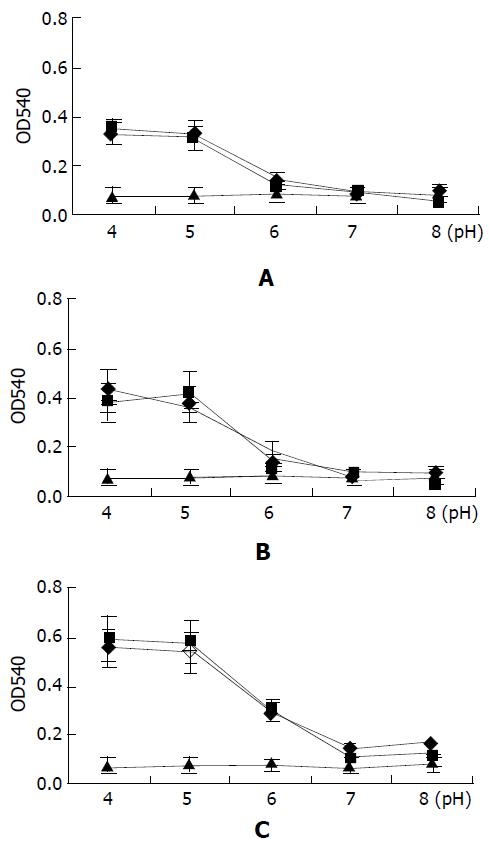
Figure 5 Fusion of plasmid DNA/liposome complexes with chicken hematocyte at various pH values.
■ DC-chol/DOPE 6:4,◆ octadecanol-galactoside:DC-chol:DOPE 1:6:4, πPBS buffer. Plasmid DNA was complexed with liposomes (lipid concentration: 0.5 μg/μL) at a ratio of 1:5 (wt/wt). The release of hemachrome was determined at 10 min (A), 30 min (B) and 90 min (C). Each value represents -x±s (n = 3).
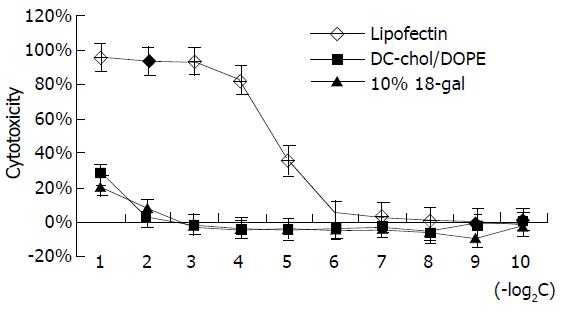
Figure 6 In vitro cytotoxicity of cationic liposomes (◆ lipofectin, ■ DC-chol/DOPE 6:4, ▲octadecanol-galactoside:DC-chol: DOPE 1:6:4).
The DNA/liposome (1:5 wt/wt) complexes were diluted with DMEM supplemented with 2% FBS in an index gradient way (initial lipid concentration: 0.5 μg/μL). Each value represents -x±s (n = 3).
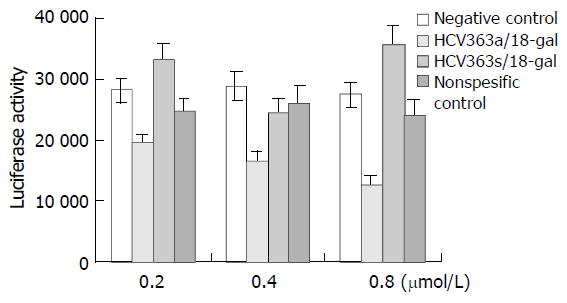
Figure 7 Effects of phosphorothioate ODNs transfected by liposome 18-gal on luciferase gene expression in HepG2.
9706 cells. Phosphorothioate ODNs were dissolved in DMEM at various concentrations (0.2 μmol/L, 0.4 μmol/L, 0.8 μmol/L) and complexed with liposome18-gal (octadecanol-galactoside: DC-chol:DOPE 1:6:4) at a ratio of 1:5 (wt/wt). Each value rep-resents -x±s (n = 3).
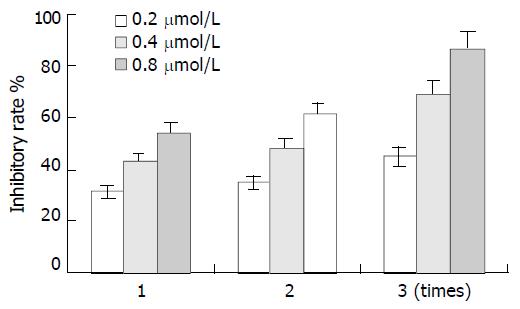
Figure 8 Effect of administration time on inhibitory efficiency of HCV363a in HepG2.
9706. Phosphorothioate ODN (HCV363a) was dissolved in DMEM at various concentrations (0.2 μmol/L, 0.4 μmol/L, 0.8 μmol/L) and complexed with li-posome18-gal (octadecanol-galactoside:DC-chol:DOPE 1:6:4) at a ratio of 1:5 (wt/wt). HepG2.9706 cells were consecutively treated 3 times with HCV363a/18-gal complexes and the ac-tivity of luciferase enzyme was determined each time 24 h af-ter HCV363a/18-gal complexes was administered. Each value represents -x±s (n = 3).
- Citation: Wen SY, Wang XH, Lin L, Guan W, Wang SQ. Preparation and property analysis of a hepatocyte targeting pH-sensitive liposome. World J Gastroenterol 2004; 10(2): 244-249
- URL: https://www.wjgnet.com/1007-9327/full/v10/i2/244.htm
- DOI: https://dx.doi.org/10.3748/wjg.v10.i2.244


