Copyright
©The Author(s) 2004.
World J Gastroenterol. Oct 1, 2004; 10(19): 2894-2897
Published online Oct 1, 2004. doi: 10.3748/wjg.v10.i19.2894
Published online Oct 1, 2004. doi: 10.3748/wjg.v10.i19.2894
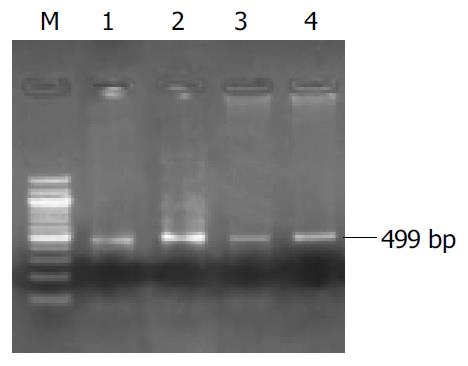
Figure 1 Expression of GHR mRNA in normal and cirrhotic liver tissues after NS or rhGH administration.
Lane 1: control group +NS (group A); Lane 2: control group +rhGH (group B); Lane 3: cirrhotic group +NS (group C); Lane 4: cirrhotic group +rhGH (group D); and Lane M: DNA standard marker of 100, 200, 300, 400, 500, 600, 700, 800, 900, 1000, 1100 and 1200 bp, respectively.
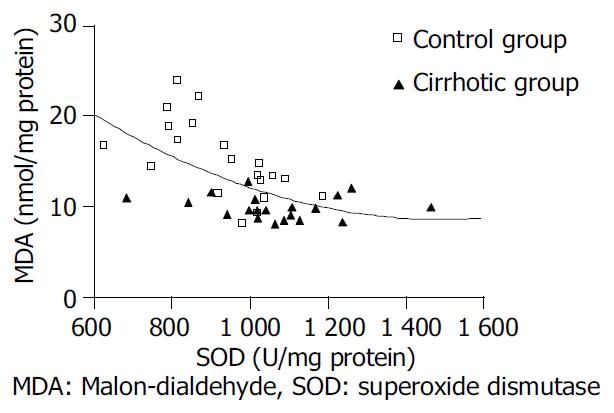
Figure 2 Correlation analysis of SOD and MDA.
- Citation: Chen S, Wang HT, Yang B, Fu YR, Ou QJ. Protective effects of recombinant human growth hormone on cirrhotic rats. World J Gastroenterol 2004; 10(19): 2894-2897
- URL: https://www.wjgnet.com/1007-9327/full/v10/i19/2894.htm
- DOI: https://dx.doi.org/10.3748/wjg.v10.i19.2894


