Copyright
©The Author(s) 2004.
World J Gastroenterol. Oct 1, 2004; 10(19): 2883-2885
Published online Oct 1, 2004. doi: 10.3748/wjg.v10.i19.2883
Published online Oct 1, 2004. doi: 10.3748/wjg.v10.i19.2883
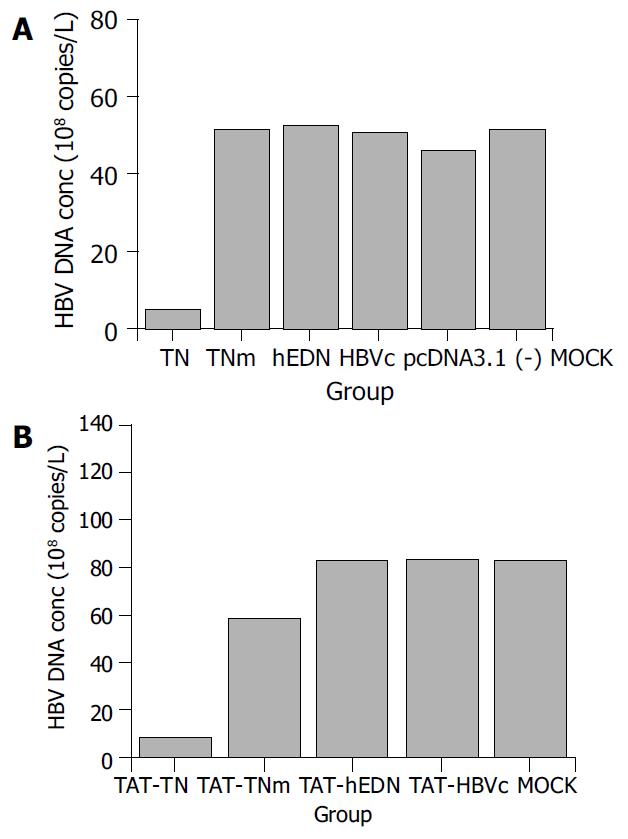
Figure 1 HBV DNA concentration in the supernatants of tranfected and transducted 2.
2.15 cells. A: HBV DNA concen-tration in the supernatants of transfected 2.2.15 cells. TN, TNm, hEDN, HBVc, pcDNA3.1 (-), and MOCK represent the super-natants collected from 2.2.15 cells transfected by p/TN, p/TNm, p/hEDN, p/HBVc, pcDNA3.1 (-), or mock solution (DMEM plus LipofectamineTM 2000 reagent containing no plasmid), respectively. B: HBV DNA concentrations in the supernatants of transducted 2.2.15 cells. TAT-TN, TAT-TNm, TAT-hEDN, TAT-HBVc, and MOCK represent the supernatants collected from 2.2.15 cells transducted by purified proteins of TAT-TN, TAT-TNm, TAT-hEDN, TAT-HBVc, or mock solution (DMEM), respectively.
- Citation: Liu J, Li YH, Ding J, Gong WD, Xue CF, Zhao Y, Huang YX. Quantifying anti-HBV effect of targeted ribonuclease by real-time fluorescent PCR. World J Gastroenterol 2004; 10(19): 2883-2885
- URL: https://www.wjgnet.com/1007-9327/full/v10/i19/2883.htm
- DOI: https://dx.doi.org/10.3748/wjg.v10.i19.2883


