Copyright
©The Author(s) 2004.
World J Gastroenterol. Oct 1, 2004; 10(19): 2842-2845
Published online Oct 1, 2004. doi: 10.3748/wjg.v10.i19.2842
Published online Oct 1, 2004. doi: 10.3748/wjg.v10.i19.2842
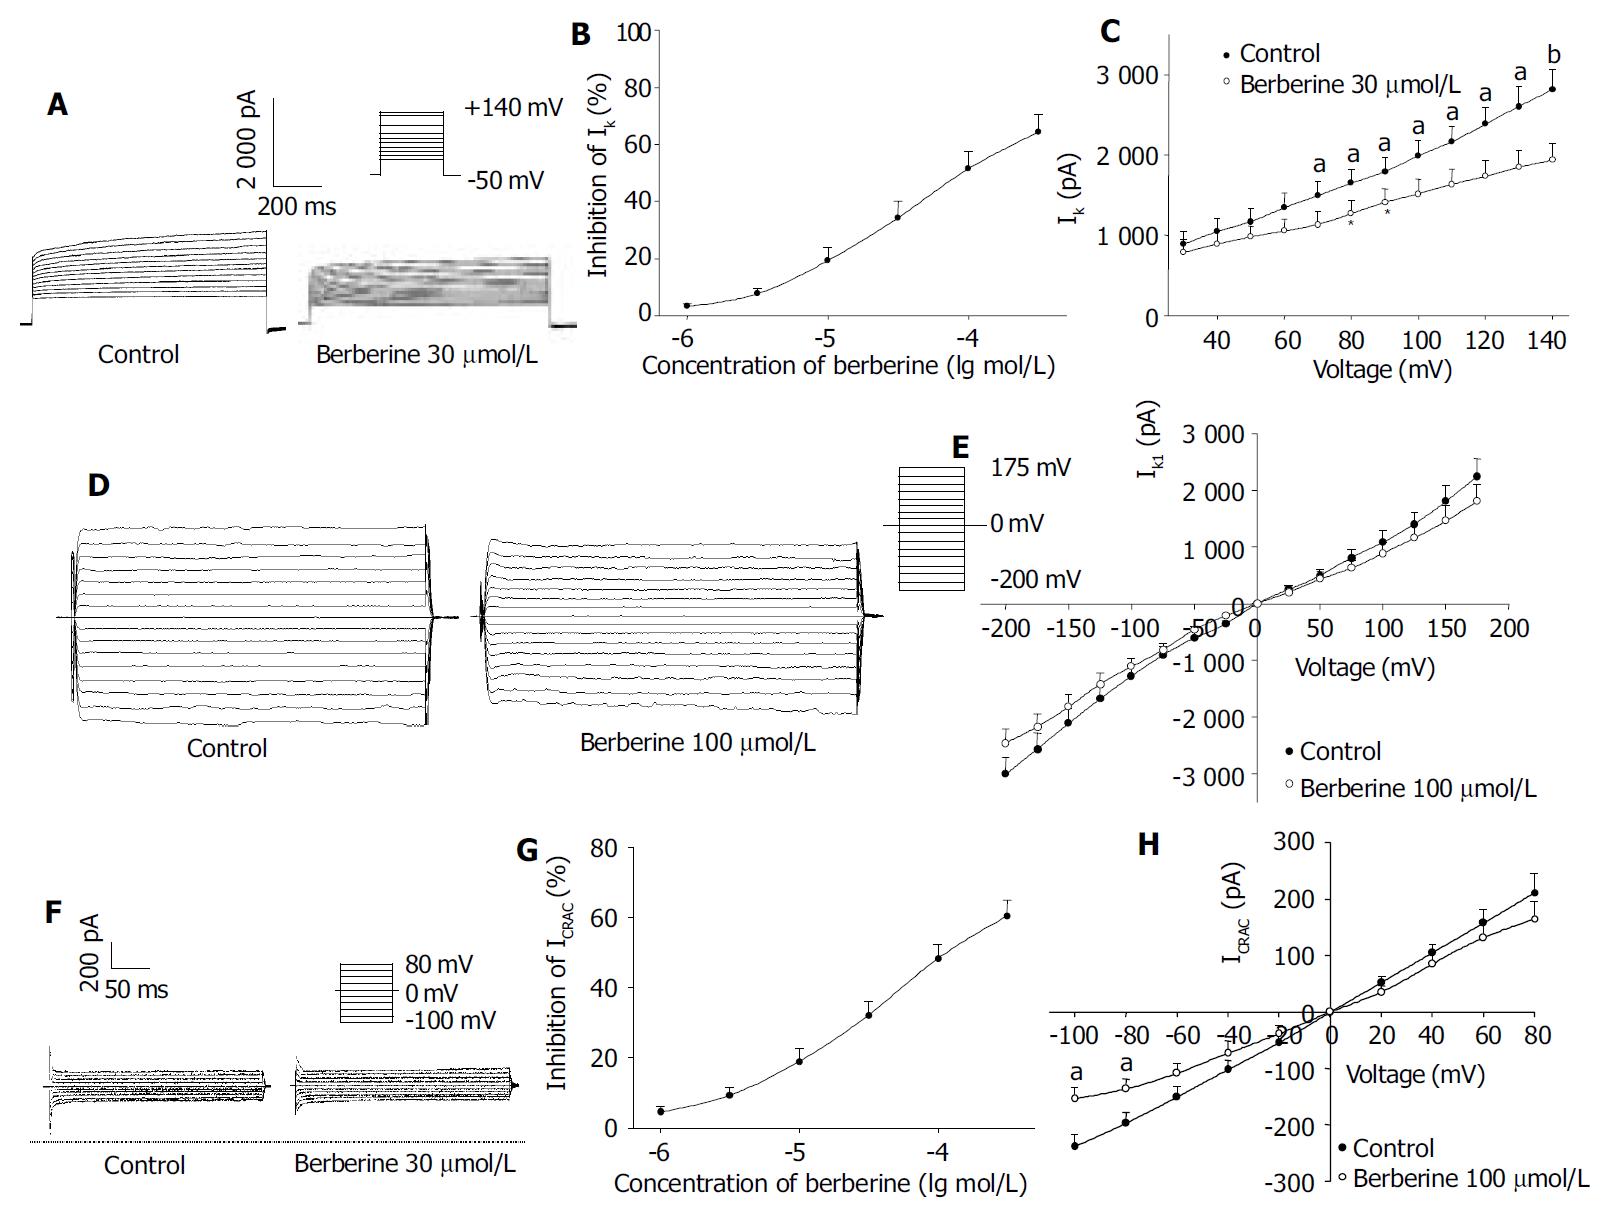
Figure 1 Effects of berberine on IK.
A: Families of IK recorded with changes in the absence or presence of berberine 30 μmol/L and 100 μmol/L. Dotted line indicates zero current level; B: Dose-response curve for effects of berberine on IK; C: I-V relationship of IK under control (●) and berberine 30 μmol/L (○). D: Families of IK1 recorded with changes in the absence or presence of berberine 100 μmol/L. Dotted line indicates zero current level; E: I-V relationship of IK1 under control (●) and berberine 100 μmol/L (○). F: Families of ICRAC recorded with changes in the absence or presence of berberine 30 μmol/L. Dotted line indicates zero current level; G: Dose-response curve for effects of berberine on ICRAC; H: I-V relationship of ICRAC under control (●) and berberine 30 μmol/L (○). The voltage steps used to elicit IK are shown in the inset. n = 8, mean ± SD, aP < 0.05, bP < 0.01 vs control.
- Citation: Wang F, Zhou HY, Zhao G, Fu LY, Cheng L, Chen JG, Yao WX. Inhibitory effects of berberine on ion channels of rat hepatocytes. World J Gastroenterol 2004; 10(19): 2842-2845
- URL: https://www.wjgnet.com/1007-9327/full/v10/i19/2842.htm
- DOI: https://dx.doi.org/10.3748/wjg.v10.i19.2842


