Copyright
©The Author(s) 2004.
World J Gastroenterol. Oct 1, 2004; 10(19): 2836-2841
Published online Oct 1, 2004. doi: 10.3748/wjg.v10.i19.2836
Published online Oct 1, 2004. doi: 10.3748/wjg.v10.i19.2836
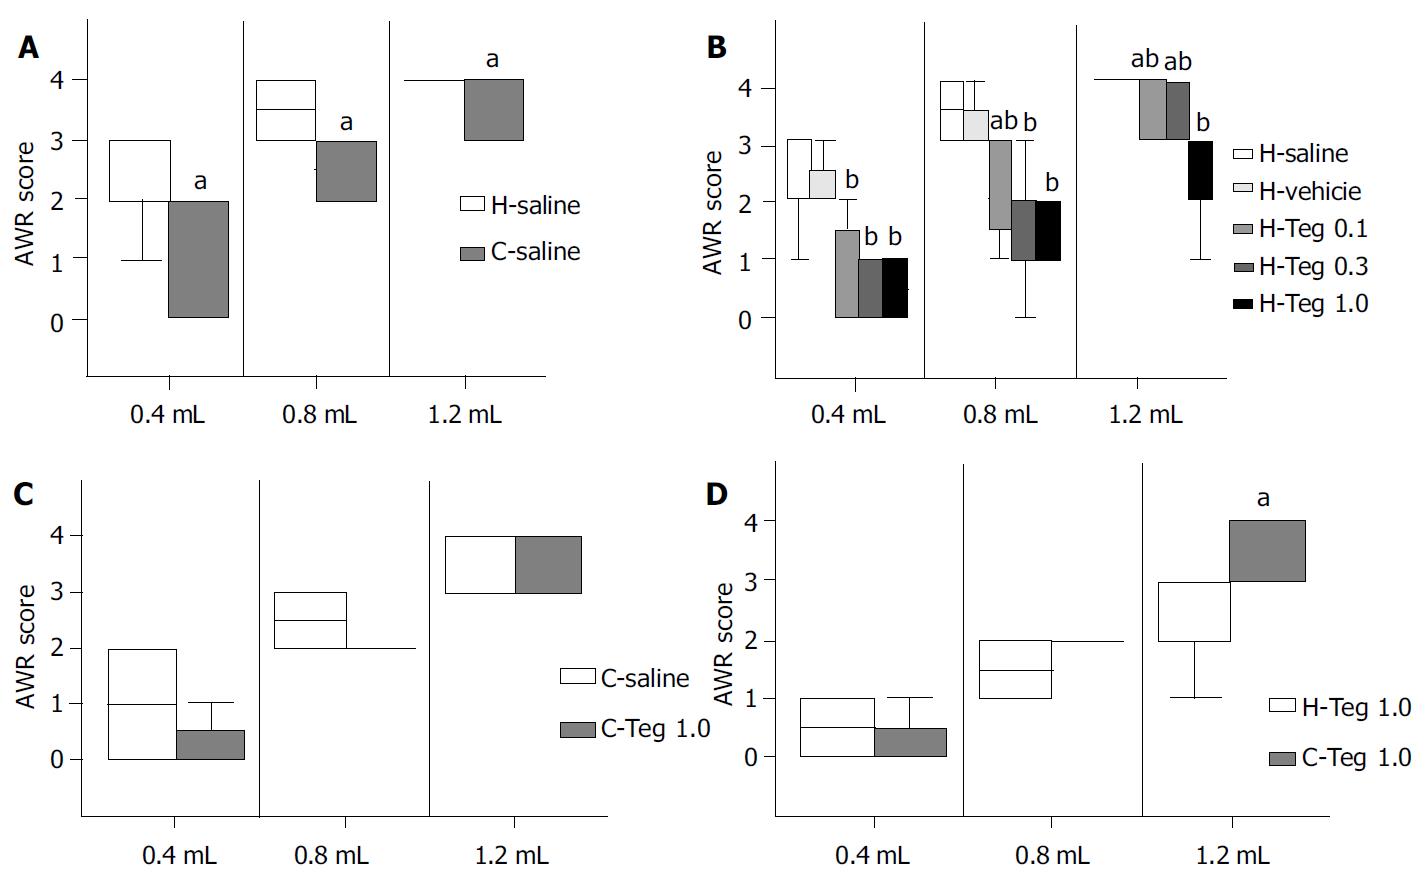
Figure 1 AWR scores of H-saline and C-saline, group H, group C, H-Teg1.
0 and C-Teg1.0, aP < 0.05; bP < 0.01. A: AWR scores of H-saline and C-saline. B: AWR scores of group H. C: AWR scores of group C. D: AWR scores of H-Teg1.0 and C-Teg1.0.
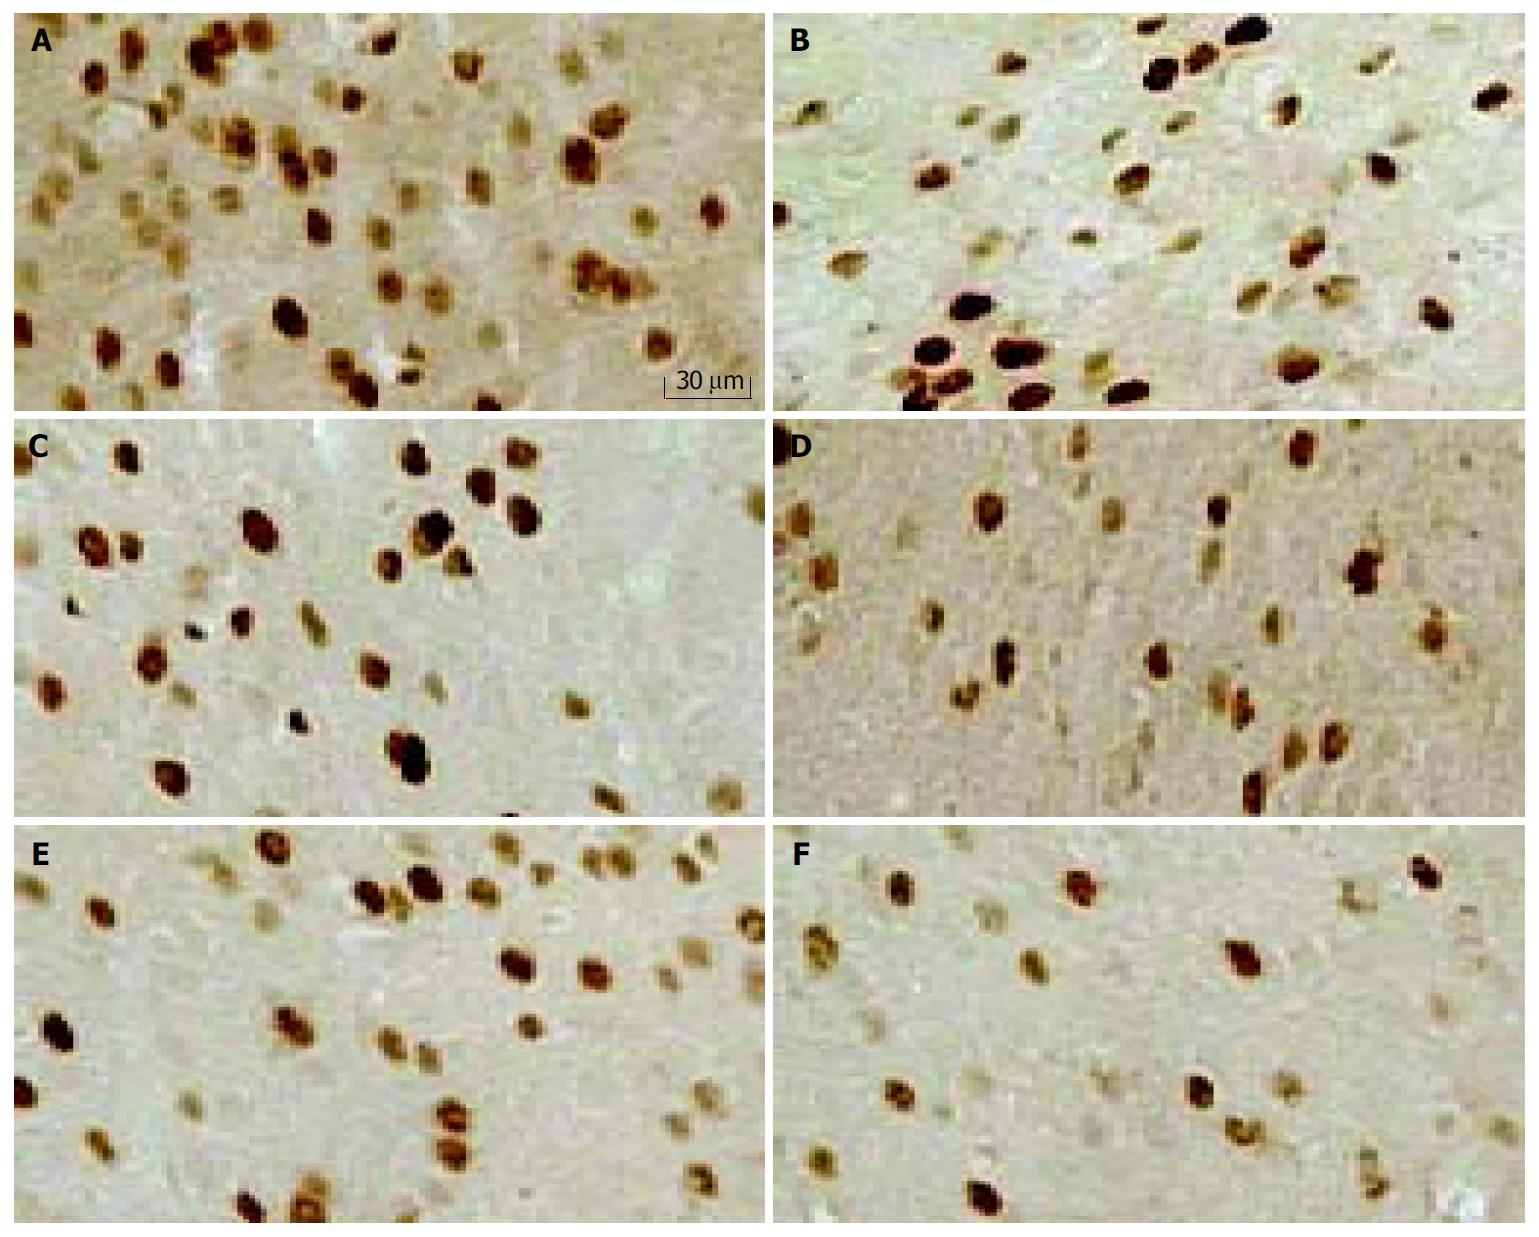
Figure 2 c-Fos-ir nuclei in anterior cingulate cortex (ACC) (200 ×).
A: H-saline; B: H-Teg0.1; C: H-Teg0.3; D: H-Teg1.0; E: C-saline; F: C-Teg1.0.
Figure 3 Number of overall c-Fos-ir nuclei and in each of the 5 areas as a percent of H-saline and C-saline.
A: Number of overall c-Fos-ir nuclei and in each of the 5 areas as a percent of H-saline. B: Number of overall c-Fos-ir nuclei and in each of the 5 areas as a percent of C-saline.
- Citation: Jiao HM, Xie PY. Tegaserod inhibits noxious rectal distention induced responses and limbic system c-Fos expression in rats with visceral hypersensitivity. World J Gastroenterol 2004; 10(19): 2836-2841
- URL: https://www.wjgnet.com/1007-9327/full/v10/i19/2836.htm
- DOI: https://dx.doi.org/10.3748/wjg.v10.i19.2836


