Copyright
©The Author(s) 2004.
World J Gastroenterol. Oct 1, 2004; 10(19): 2831-2835
Published online Oct 1, 2004. doi: 10.3748/wjg.v10.i19.2831
Published online Oct 1, 2004. doi: 10.3748/wjg.v10.i19.2831
Figure 1 Regulation of proliferation in LX-2 and HepG2 cells by Cpd 861.
A: Effect of 0.1 mg/mL Cpd 861 on LX-2 cell proliferation. B: Effect of 0.1 mg/mL Cpd 861 on HepG2 cell proliferation. Data are expressed as the mean ± SE of 3 replicates. aP < 0.05 vs LX-2 cell controls after 3 d of incubation. dP < 0.01 vs LX-2 cell controls after 5 d of incubation. fP < 0.01 vs LX-2 cell controls after 7 d of incubation.
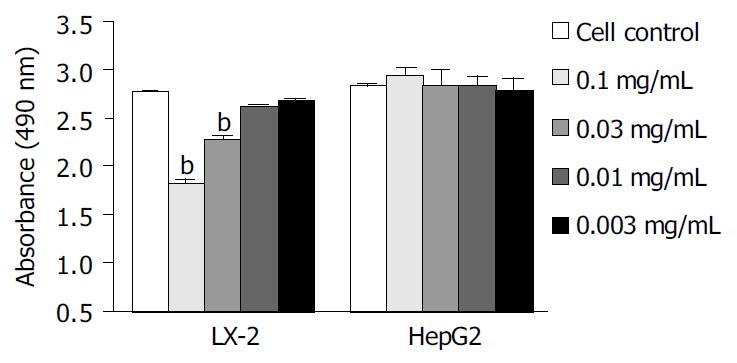
Figure 2 Dose dependent effects of Cpd 861 on cell prolifera-tion in LX-2 and HepG2 7 d after incubation.
Data are expressed as the mean ± SE of 3 replicates. bP < 0.01 vs LX-2 cell controls.
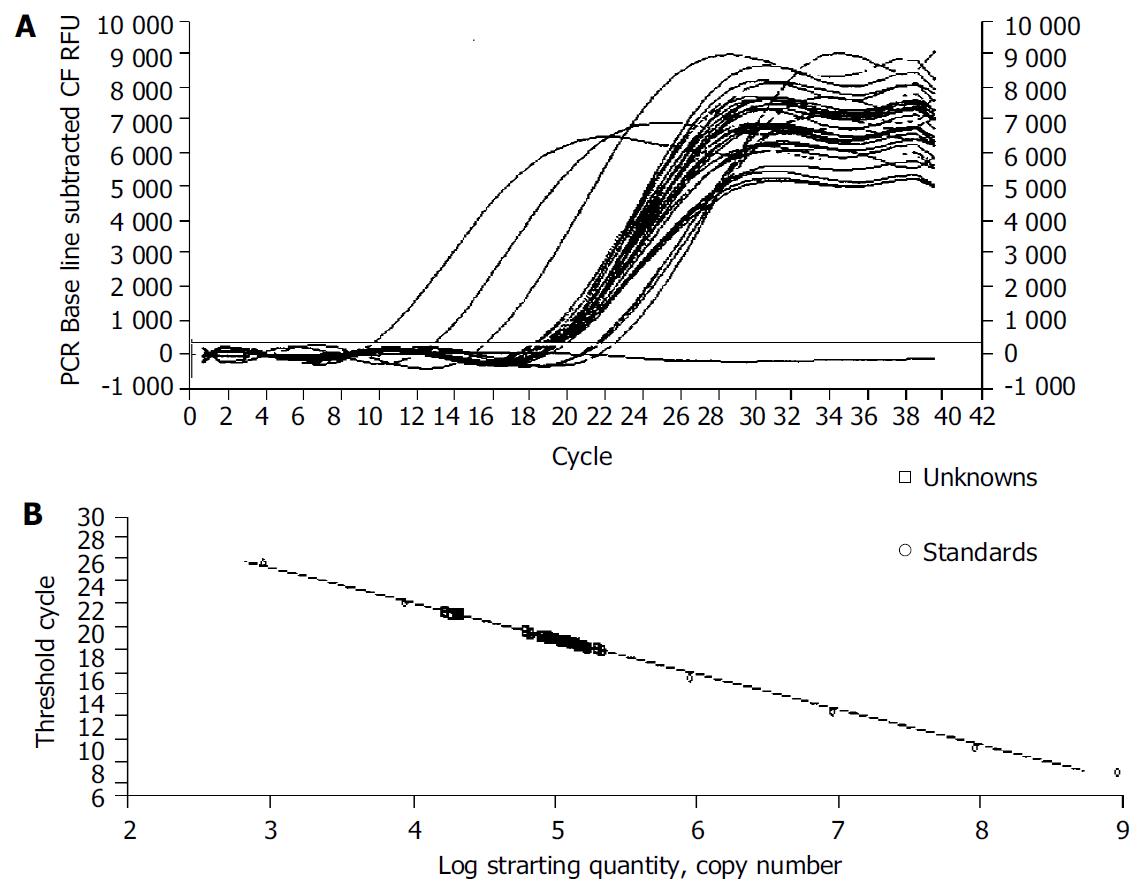
Figure 3 Fluorescence data (A) and standard curve (B) for α-SMA generated on iCycler iQ real-time PCR detection system.
Plasmids containing the fragments for α-SMA were diluted from 109 to 103 copies.
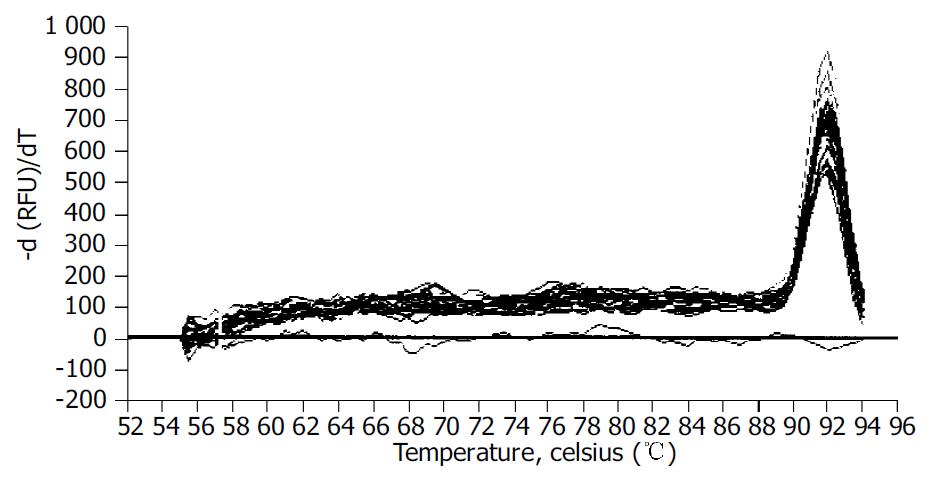
Figure 4 Melting curve for all PCR products after amplification.
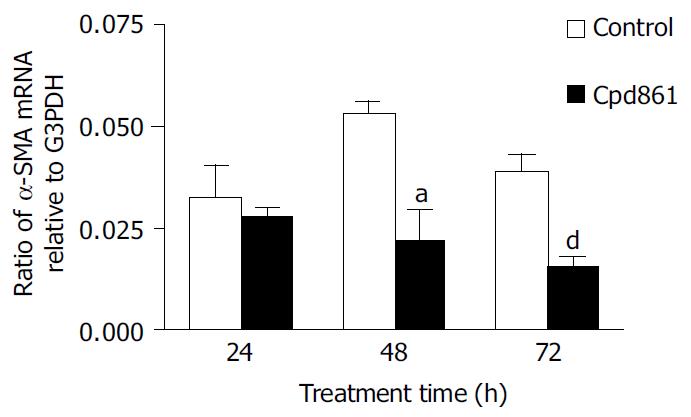
Figure 5 Effects of Cpd 861 on expression of α-SMA mRNA in LX-2 cells.
LX-2 cells were incubated with 0.01 mg/mL Cpd 861 for different time. The relative number of molecules of α-SMA mRNA after normalization to G3PDH was calculated. The data represent mean ± SE of 4 replicates for each treatment. aP < 0.05 vs LX-2 cell controls after 48 h of incubation. dP < 0.01 vs LX-2 cell controls after 72 h of incubation.
- Citation: Wang L, Wang J, Wang BE, Xiao PG, Qiao YJ, Tan XH. Effects of herbal compound 861 on human hepatic stellate cell proliferation and activation. World J Gastroenterol 2004; 10(19): 2831-2835
- URL: https://www.wjgnet.com/1007-9327/full/v10/i19/2831.htm
- DOI: https://dx.doi.org/10.3748/wjg.v10.i19.2831


