Copyright
©The Author(s) 2004.
World J Gastroenterol. Oct 1, 2004; 10(19): 2818-2822
Published online Oct 1, 2004. doi: 10.3748/wjg.v10.i19.2818
Published online Oct 1, 2004. doi: 10.3748/wjg.v10.i19.2818
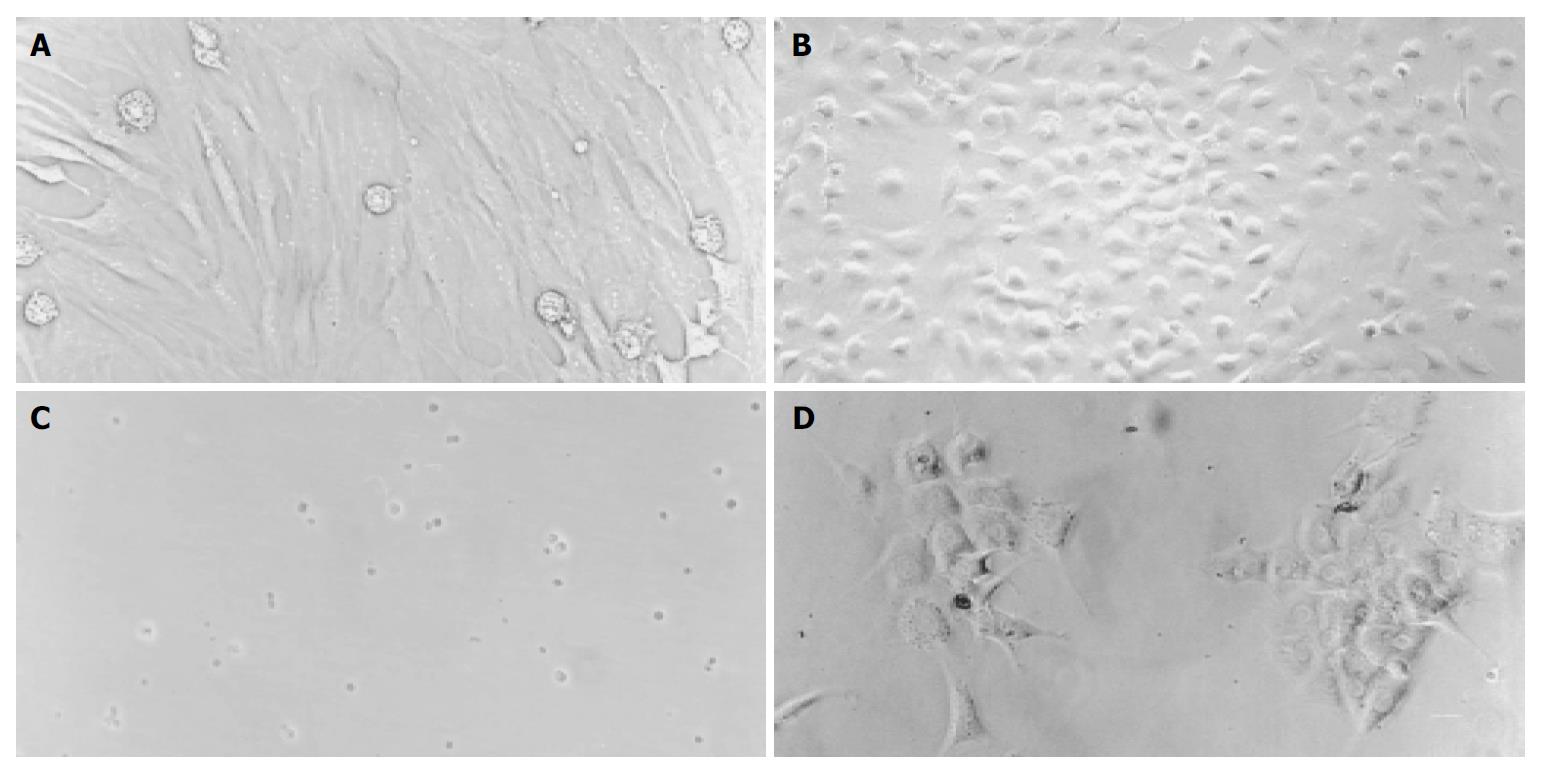
Figure 1 A-D Cell morphology before and after differentiation (Original magnification, 200 ×).
A: Fibroblast-like MSC before differentiation, B: Round MSC after differentiation, C: Freshly isolated Thy1.1+ cells, D: Thy1.1+ cells 10 d after differentiation.
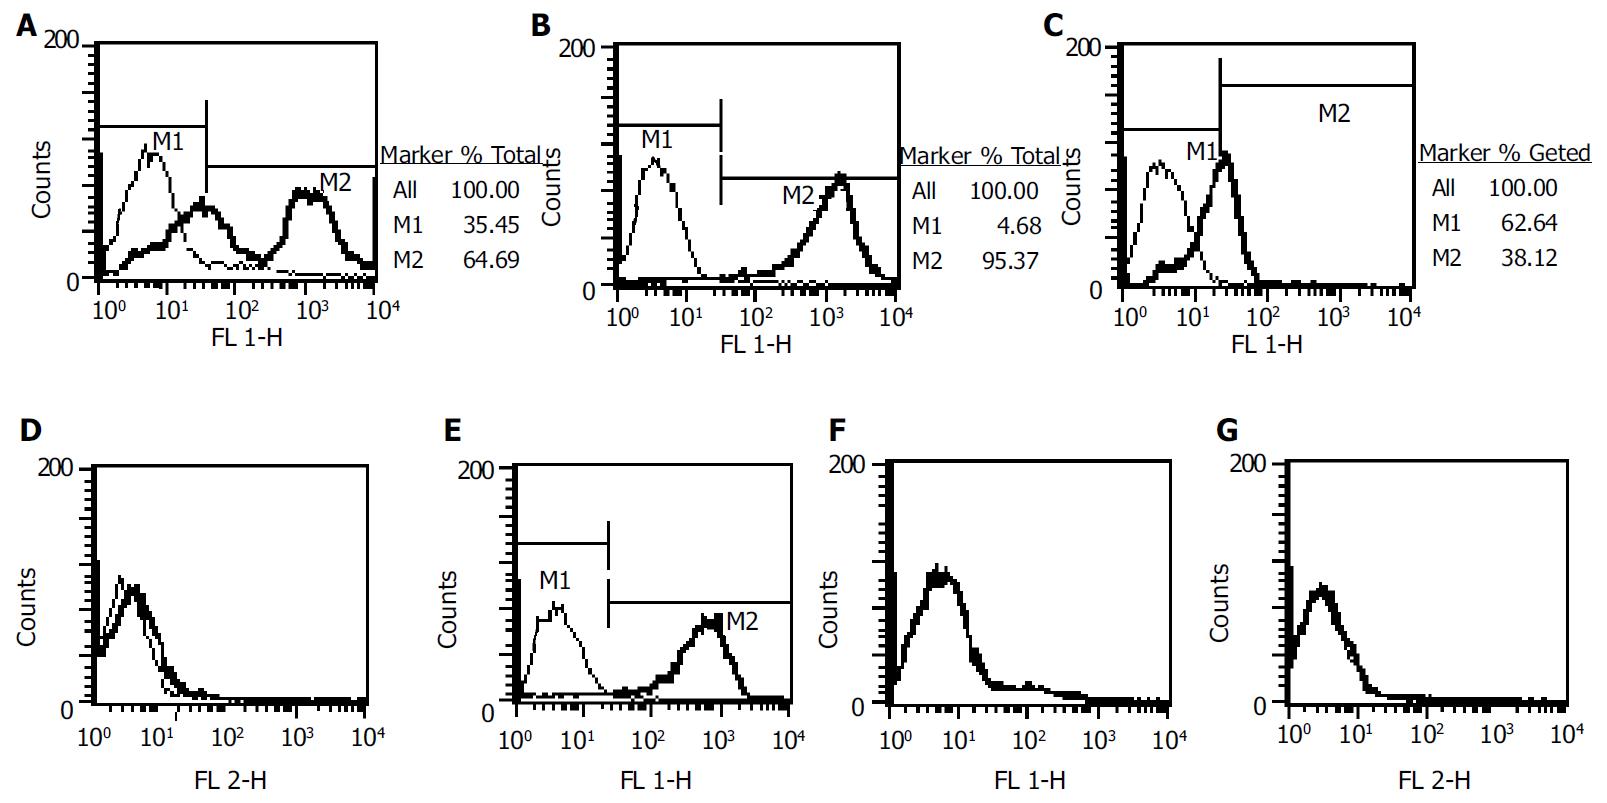
Figure 2 Phenotype analysis of MSCs and Thy-1.
1+ cells. A: Thy-1.1 of mononuclear bone marrow cells before MACS; B, C, D: Thy-1.1, CD45, CD34 after MACS purification; E, F, G: Thy-1.1, CD45, CD34 of MSCs.
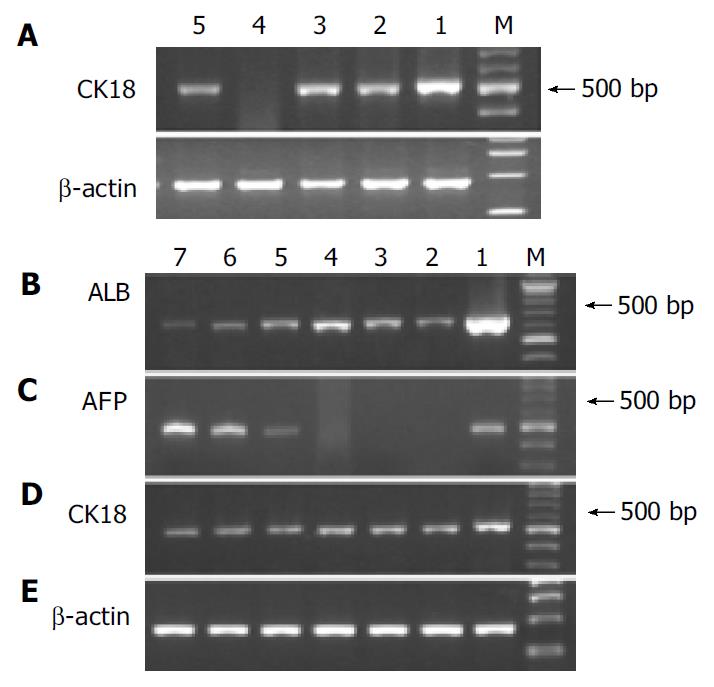
Figure 3 RT-PCR analysis of hepatic gene expression before and after differentiation.
A: Analysis of CK18 mRNA before differentiation, lane 1: Adult liver, lane 2: Mononuclear BM cells.
Figure 4 Immunocytofluorescence.
A: MSCs-albumin, B: Thy1.1+ cells-CK18, C: Thy1.1+ cells-AFP.
- Citation: Shu SN, Wei L, Wang JH, Zhan YT, Chen HS, Wang Y. Hepatic differentiation capability of rat bone marrow-derived mesenchymal stem cells and hematopoietic stem cells. World J Gastroenterol 2004; 10(19): 2818-2822
- URL: https://www.wjgnet.com/1007-9327/full/v10/i19/2818.htm
- DOI: https://dx.doi.org/10.3748/wjg.v10.i19.2818


