Copyright
©The Author(s) 2004.
World J Gastroenterol. Oct 1, 2004; 10(19): 2795-2799
Published online Oct 1, 2004. doi: 10.3748/wjg.v10.i19.2795
Published online Oct 1, 2004. doi: 10.3748/wjg.v10.i19.2795
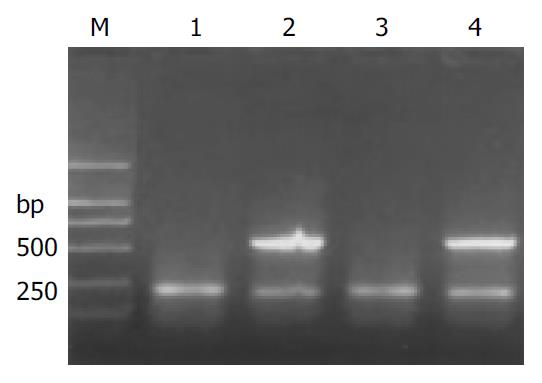
Figure 1 Expression of HPA mRNA in HCC.
M: molecular mass markers (DL2000); lanes 1 and 3: the noncancerous liver tissue; lanes 2 and 4: the HPA positive samples of cancer tissues both with a bright band at 585 bp.
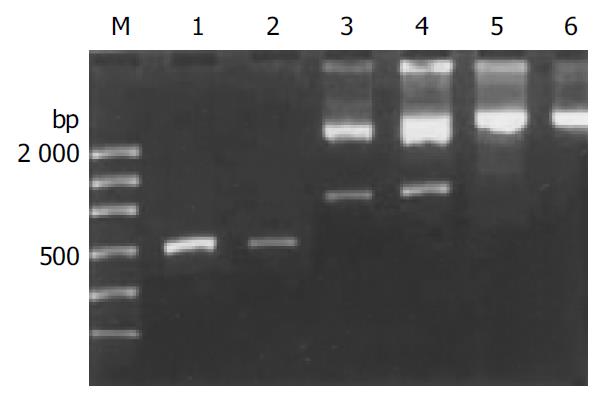
Figure 2 Electrophoretogram of the recombinant plasmid DNA digested by EcoRI.
M: molecular mass markers (DL2000); lanes 1 and 2: the pure HPA RT-PCR products; lanes 3 and 4: the products of digestion; lanes 5 and 6: the products without digestion.
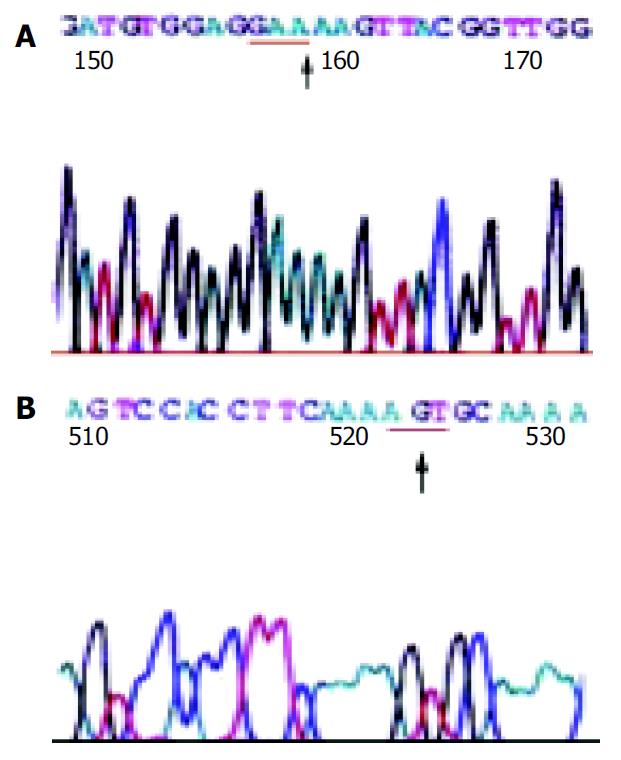
Figure 3 The sequencing map 1 (A) and map 2 (B) ↑, the mu-tated base; the parts with underline, the codons.
- Citation: Chen XP, Liu YB, Rui J, Peng SY, Peng CH, Zhou ZY, Shi LH, Shen HW, Xu B. Heparanase mRNA expression and point mutation in hepatocellular carcinoma. World J Gastroenterol 2004; 10(19): 2795-2799
- URL: https://www.wjgnet.com/1007-9327/full/v10/i19/2795.htm
- DOI: https://dx.doi.org/10.3748/wjg.v10.i19.2795


