Copyright
©The Author(s) 2004.
World J Gastroenterol. Sep 1, 2004; 10(17): 2574-2579
Published online Sep 1, 2004. doi: 10.3748/wjg.v10.i17.2574
Published online Sep 1, 2004. doi: 10.3748/wjg.v10.i17.2574
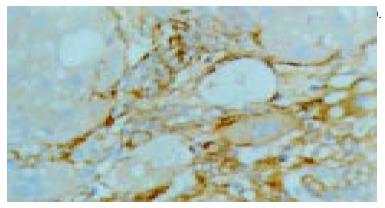
Figure 1 MMP-2-positive cells in the model group (S-P method, × 200).
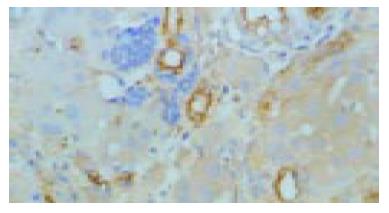
Figure 2 MMP-2-positive cells in the IL-10 treatment group (S-P method, × 200).
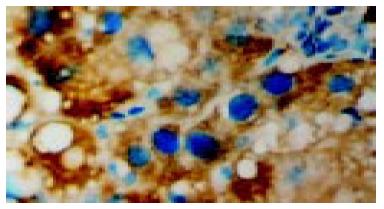
Figure 3 TIMP-1-positive cells in the model group (S-P method, × 400).
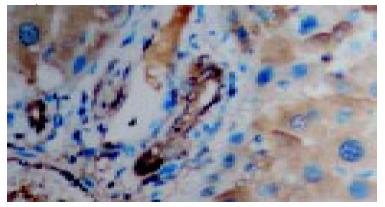
Figure 4 TIMP-1-positive cells in IL-10 treatment group (S-P method, × 400).
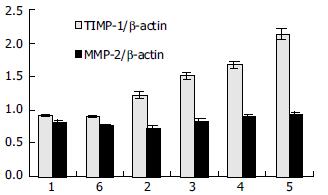
Figure 5 Effects of PDGF on TIMP-1 and MMP-2 expressions in HSCs.
1: Control group (2 h) ; 2: PDGF-treated group (2 h) ; 3: PDGF-treated group (4 h) ; 4: PDGF-treated group (8 h) ; 5: PDGF-treated group (24 h) ; 6: Control group (24 h).
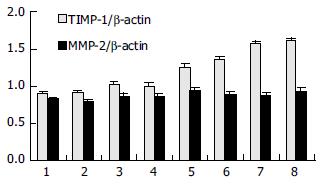
Figure 6 Effects of IL-10 and PDGF on TIMP-1 and MMP-2 expressions in HSCs.
1: Blank control group (2 h) ; 2: Blank control group (24 h) ; 3: Negative control group (2 h) ; 4: Treatment group (2 h) ; 5: Negative control group (12 h) ; 6: Treatment group (12 h) ; 7: Negative control group (24 h) ; 8: Treatment group (24 h).
- Citation: Zhang LJ, Chen YX, Chen ZX, Huang YH, Yu JP, Wang XZ. Effect of interleukin-10 and platelet-derived growth factor on expressions of matrix metalloproteinases-2 and tissue inhibitor of metalloproteinases-1 in rat fibrotic liver and cultured hepatic stellate cells. World J Gastroenterol 2004; 10(17): 2574-2579
- URL: https://www.wjgnet.com/1007-9327/full/v10/i17/2574.htm
- DOI: https://dx.doi.org/10.3748/wjg.v10.i17.2574


