Copyright
©The Author(s) 2004.
World J Gastroenterol. Aug 1, 2004; 10(15): 2190-2194
Published online Aug 1, 2004. doi: 10.3748/wjg.v10.i15.2190
Published online Aug 1, 2004. doi: 10.3748/wjg.v10.i15.2190
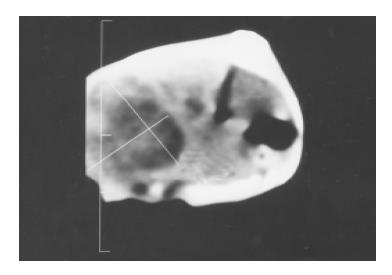
Figure 1 CT scan of the liver cancer 7 d after implantation.
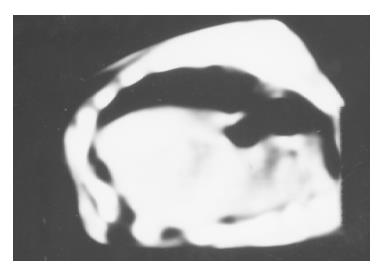
Figure 2 CT scan of the tumor treated with IL-2/IL-12 fused gene after 2 mo.
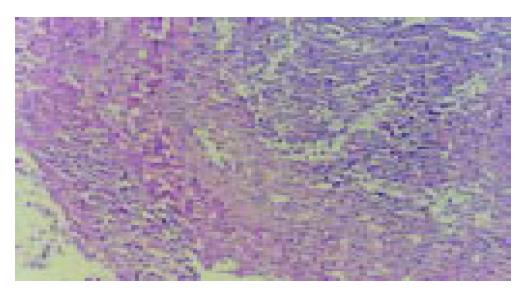
Figure 3 Pathological changes of implanted liver cancer (HE staining, original magnification: × 200).
There are numerous lymphocytes in tumor tissues.
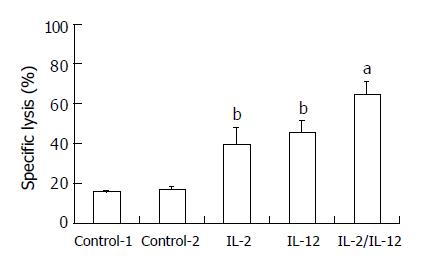
Figure 4 Activation of NK cell activity after administration of IL-2 and/or IL-12 (n = 5).
bP < 0.01 vs control; aP < 0.05 vs IL-2 group or IL-12 group.
- Citation: You TG, Wang HS, Yang JH, Qian QJ, Fan RF, Wu MC. Transfection of IL-2 and/or IL-12 genes into spleen in treatment of rat liver cancer. World J Gastroenterol 2004; 10(15): 2190-2194
- URL: https://www.wjgnet.com/1007-9327/full/v10/i15/2190.htm
- DOI: https://dx.doi.org/10.3748/wjg.v10.i15.2190


