Copyright
©The Author(s) 2004.
World J Gastroenterol. Aug 1, 2004; 10(15): 2168-2173
Published online Aug 1, 2004. doi: 10.3748/wjg.v10.i15.2168
Published online Aug 1, 2004. doi: 10.3748/wjg.v10.i15.2168
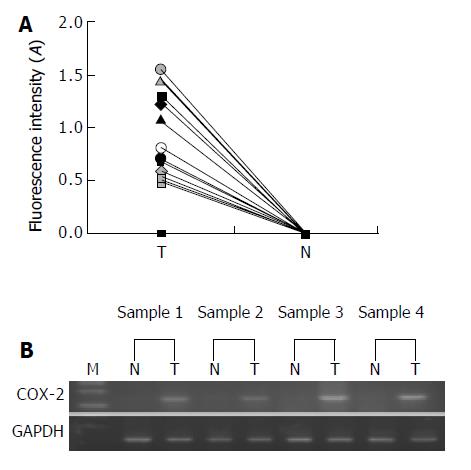
Figure 1 Semiquantitative result of RT-PCR analysis of COX-2 mRNA expression in squamous carcinoma tissues and matched normal tissues of the esophagus.
A: Data are expressed as the fluorescence values of COX-2 band in tumor and nontumorous tissue samples from 30 patients with esophageal squamous cell carcinoma. B: Representative results of semiquantitative RT-PCR, indicated COX-2 mRNA was found in esophageal squamous cell carcinoma samples (T), while in surrounding normal tissue (N), COX-2 mRNA could not be detected. The coamplified GAPDH gene served as an internal control. PCR product sizes are 314 bp for COX-2 and 340 bp for GAPDH. M indicates DNA marker. The samples in lanes 1N and 1T, 2N and 2T, 3N and 3T, 4N and 4T are paired samples from 4 patients, respectively.
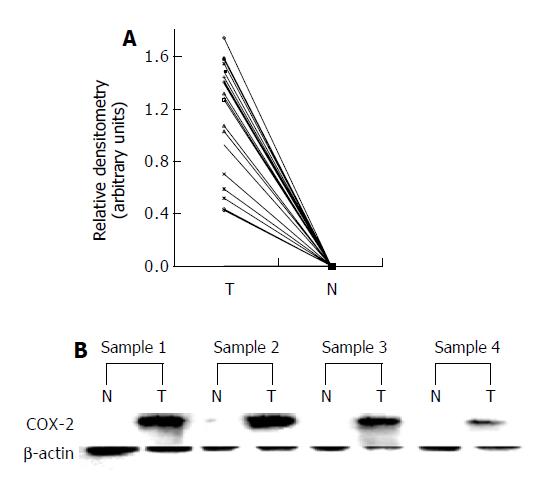
Figure 2 Western blot analysis of COX-2 in squamous carci-noma tissues and matched normal tissues of the esophagus.
COX-2 expressions in representative tumor (T) and nontumorous (N) are shown. A: Data are expressed as the absorbency values of COX-2 band in tumor and nontumorous tissue samples from 30 patients with esophageal squamous cell carcinoma. B: Representative result of Western blot analysis. COX-2 protein was detected in tumor tissue but was undetect-able in nontumorous tissue in the same patients. β -actin was used as an internal control . The samples in lanes 1N and 1T, 2N and 2T, 3N and 3T, 4N and 4T are paired samples from 4 patients, respectively.
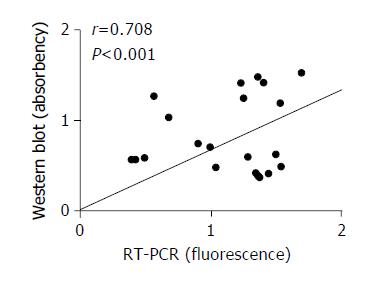
Figure 3 Correlation between western blot analysis and RT-PCR analysis results.
The results showed that the expression of COX-2 in cancer tissues (western blot analysis) was highly cor-related with by RT-PCR analysis (r value = 0.708, P < 0.001).
Figure 4 Representative results of immunohistochemical analysis of COX-2 in squamous carcinoma tissues and matched normal tissues of the esophagus from the same patient (Magnification x200).
In normal esophageal tissue there is no positive staining for COX-2 (A) but in esophageal squamous cell carcinoma tissue, carcinoma cells display a strong staining for COX-2, which indicate COX-2 expression specifically in cancer tissues (B).
Figure 5 Immunofluorescence analysis of COX-2 in squamous carcinoma tissues (Magnification, x400).
A and B are from 2 different patients with esophageal squamous cell carcinoma, Both display a strong green fluorescence staining for COX-2 in cancer-nests.
- Citation: Jiang JG, Tang JB, Chen CL, Liu BX, Fu XN, Zhu ZH, Qu W, Cianflone K, Waalkes MP, Wang DW. Expression of cyclooxygenase-2 in human esophageal squamous cell carcinomas. World J Gastroenterol 2004; 10(15): 2168-2173
- URL: https://www.wjgnet.com/1007-9327/full/v10/i15/2168.htm
- DOI: https://dx.doi.org/10.3748/wjg.v10.i15.2168


