Copyright
©The Author(s) 2004.
World J Gastroenterol. Jun 15, 2004; 10(12): 1755-1758
Published online Jun 15, 2004. doi: 10.3748/wjg.v10.i12.1755
Published online Jun 15, 2004. doi: 10.3748/wjg.v10.i12.1755
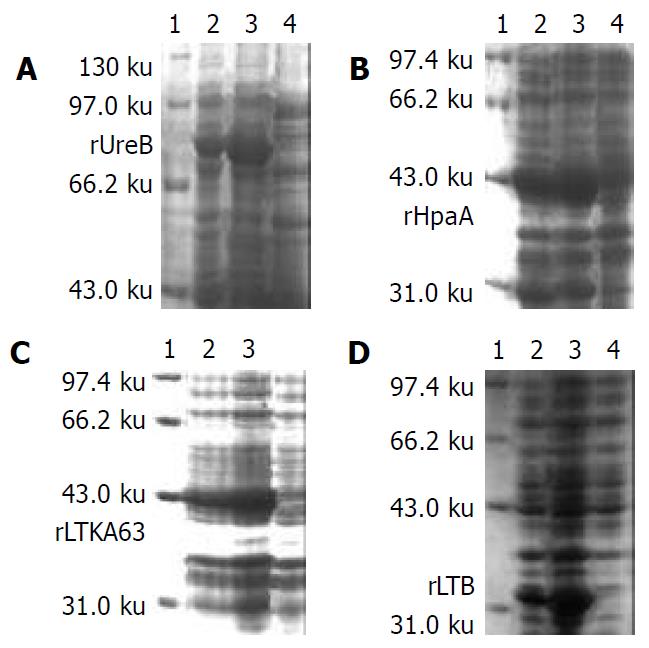
Figure 1 Effects of lactose on inducing expression of target recombinant proteins compared to IPTG.
A: rUreB; Lane 1: Marker; Lane 2: Induced with 0.5 mmol/L IPTG; Lane 3: In-duced with 100 g/L lactose; Lane 4: Non-induced. B: rHpaA; Lane 1: Marker; Lane 2: Induced with 0.5 mmol/L IPTG; Lane 3: Induced with 50 g/L lactose; Lane 4: Non-induced. C: rLTKA63 expression; Lane 1: Marker; Lane 2: Induced with 0.5 mmol/L IPTG; Lane 3: Induced with 100 g/L lactose. Lane 4: Non-induced; D: rLTB; Lane 1: Marker; Lane 2: Induced with 0.5 mmol/L IPTG; Lane 3: Induced with 100 g/L lactose; Lane 4: Non-induced.
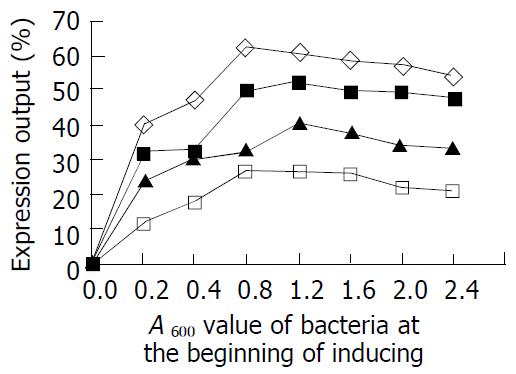
Figure 2 Expression of target recombinant proteins of original bacteria with different A600 values under inducement by lactose.
◇: rHpaA; ■: rUreB; ▲: rLTB; □: rLTKA63.
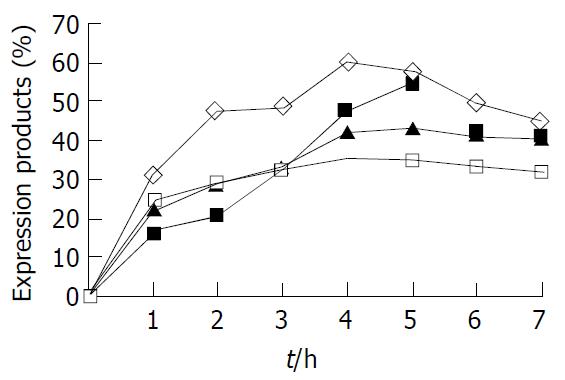
Figure 3 Expression outputs of the target proteins by using different inducing time.
◇: rHpaA; ■: rUreB; ▲: rLTB; □: rLTKA63.
-
Citation: Yan J, Zhao SF, Mao YF, Luo YH. Effects of lactose as an inducer on expression of
Helicobacter pylori rUreB and rHpaA, andEscherichia coli rLTKA63 and rLTB. World J Gastroenterol 2004; 10(12): 1755-1758 - URL: https://www.wjgnet.com/1007-9327/full/v10/i12/1755.htm
- DOI: https://dx.doi.org/10.3748/wjg.v10.i12.1755


