Copyright
©The Author(s) 2004.
World J Gastroenterol. Jun 15, 2004; 10(12): 1746-1749
Published online Jun 15, 2004. doi: 10.3748/wjg.v10.i12.1746
Published online Jun 15, 2004. doi: 10.3748/wjg.v10.i12.1746
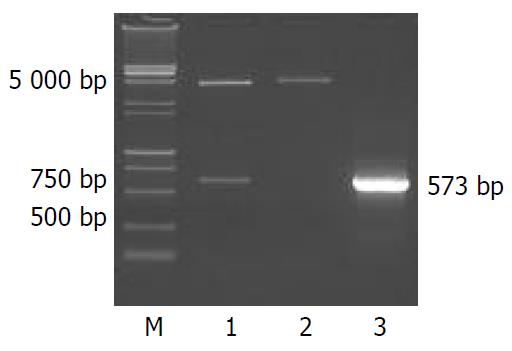
Figure 1 Products of pcDNA3.
1(-)-core PCR and restriction enzyme cleavage were electrophoresed in 1% agarose gel. Lane 1: EcoRI/BamHI cleaved; lane 2: HindIII cleaved; lane 3: prod-ucts of plasmid PCR; M: DNA marker, (15 000 bp+ 2 000 bp).
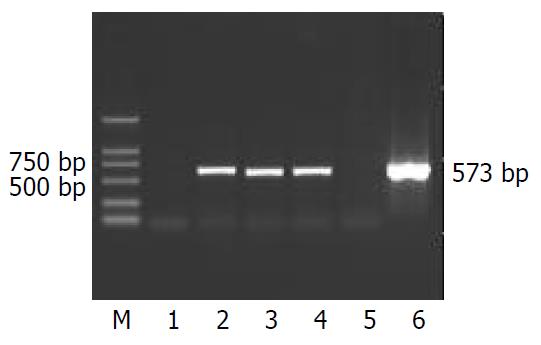
Figure 2 RT-PCR products were electrophoresed in 1% agar-ose gel.
Lane 1: negative control; lanes 2-4: total RNA was iso-lated from pcDNA3.1(-)-core and RT-PCR was performed by three different Oligo dT; lane 5: blank control; lane 6: positive control; M: DNA marker (2 000 bp).
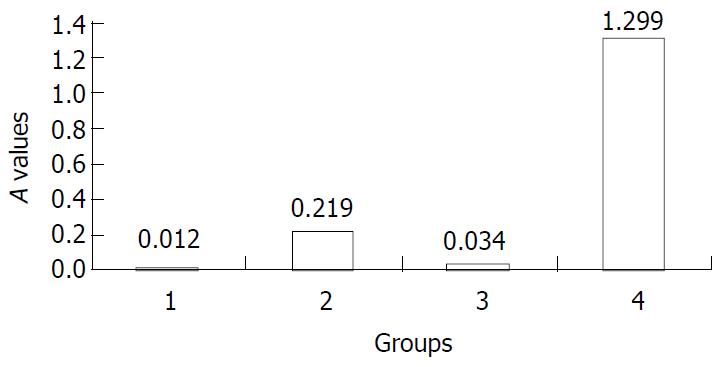
Figure 3 Comparison of A values among transfection groups.
1. Negative control (PBS); 2. pcDNA3.1(-)-core; 3. Blank plasmid; 4. Positive control.
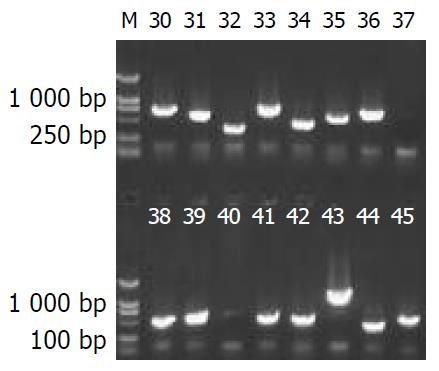
Figure 4 Agarose gel electrophoresis of PCR products of some clones (30-45).
M: DNA marker (2 000 bp).
- Citation: Liu M, Liu Y, Cheng J, Zhang SL, Wang L, Shao Q, Zhang J, Yang Q. Transactivating effect of hepatitis C virus core protein: A suppression subtractive hybridization study. World J Gastroenterol 2004; 10(12): 1746-1749
- URL: https://www.wjgnet.com/1007-9327/full/v10/i12/1746.htm
- DOI: https://dx.doi.org/10.3748/wjg.v10.i12.1746


