Copyright
©The Author(s) 2004.
World J Gastroenterol. May 15, 2004; 10(10): 1421-1424
Published online May 15, 2004. doi: 10.3748/wjg.v10.i10.1421
Published online May 15, 2004. doi: 10.3748/wjg.v10.i10.1421
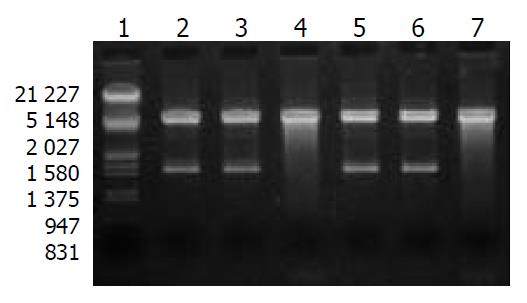
Figure 1 Restriction enzyme digestion of recombinant plas-mid pcDNA3.
1-mAST by Xba I and Hind III. Lane 1: DNA/EcoR I + Hind III Marker; Lanes 2, 3, 5, 6: positive clones; Lanes 4, 7: negative clones.
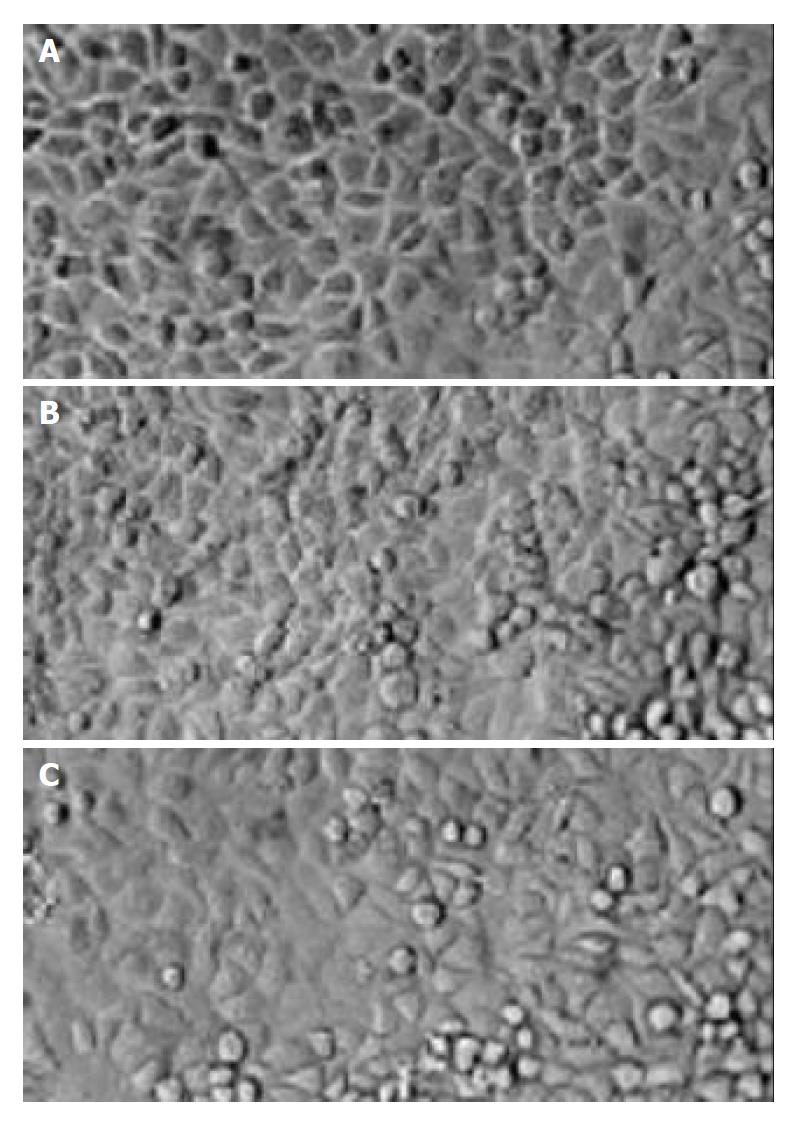
Figure 2 Morphology of HCC cells.
A: SMMC-7721 cells; B: SMCC-7721 cells transfected with pcDNA3.1 (+); C: SMCC-7721 cells transfected with pcDNA3.1-mAST.
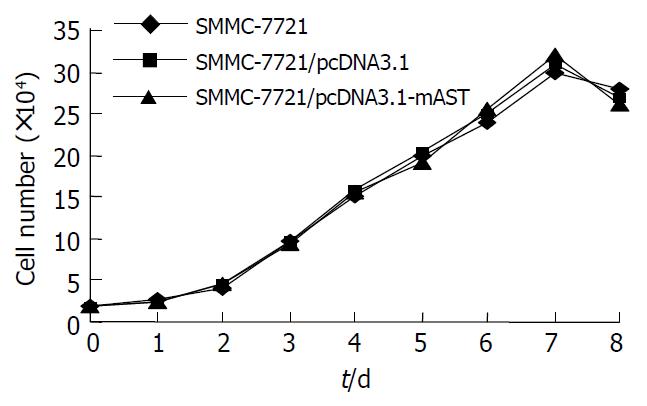
Figure 3 Growth curve of SMCC-7721 cells.
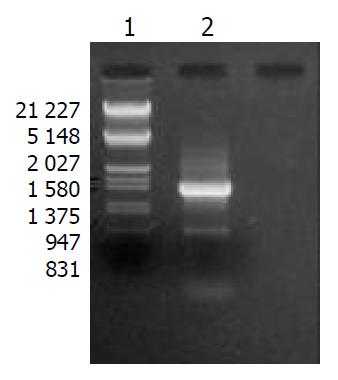
Figure 4 RT-PCR of transfected cells.
Lane 1: DNA/EcoR I + Hind III Markers; Lane 2: positive clones.
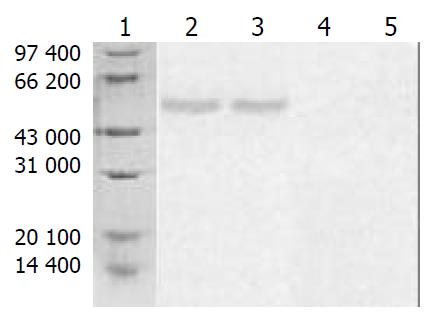
Figure 5 Western blotting of angiostatin expression.
Lane 1: Marker protein; Lanes 2, 3: SMMC-7721/pcDNA3.1-mAST; Lane 4: SMMC-7721/pcDNA3.1 (+); Lane 5: SMMC-7721.
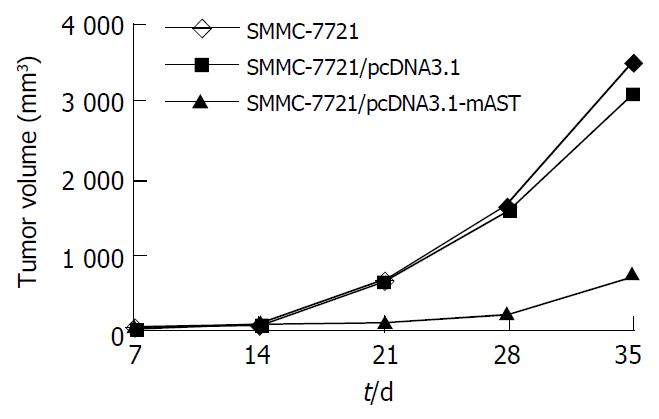
Figure 6 Growth curve of tumors.
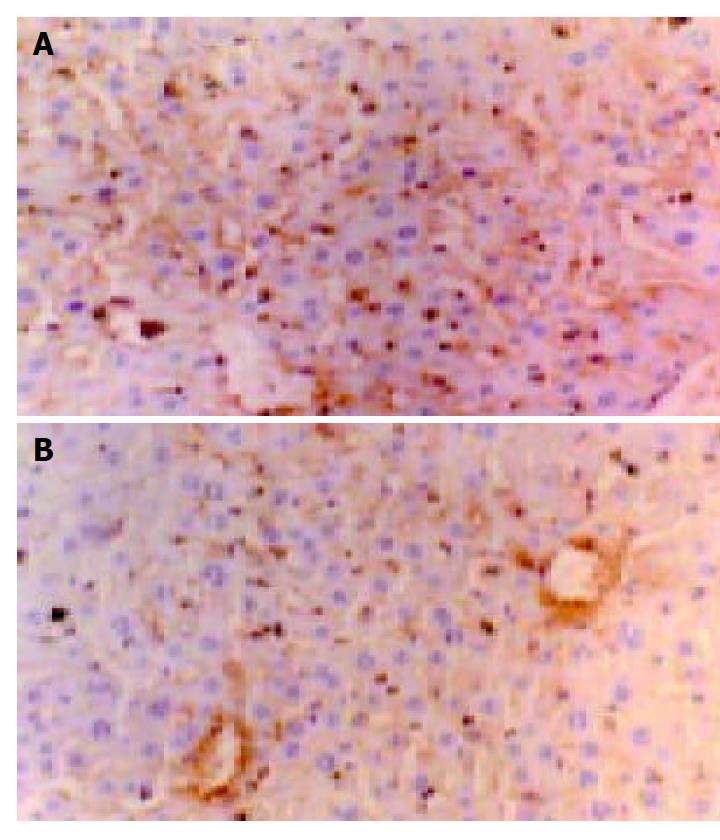
Figure 7 Immunohistochemical analysis of MVD in tumor tissue (× 200).
A: blank control group; B: angiostatin group
- Citation: Tao KS, Dou KF, Wu XA. Expression of angiostatin cDNA in human hepatocellular carcinoma cell line SMMC-7721 and its effect on implanted carcinoma in nude mice. World J Gastroenterol 2004; 10(10): 1421-1424
- URL: https://www.wjgnet.com/1007-9327/full/v10/i10/1421.htm
- DOI: https://dx.doi.org/10.3748/wjg.v10.i10.1421


