Copyright
©The Author(s) 2004.
World J Gastroenterol. Jan 1, 2004; 10(1): 96-99
Published online Jan 1, 2004. doi: 10.3748/wjg.v10.i1.96
Published online Jan 1, 2004. doi: 10.3748/wjg.v10.i1.96
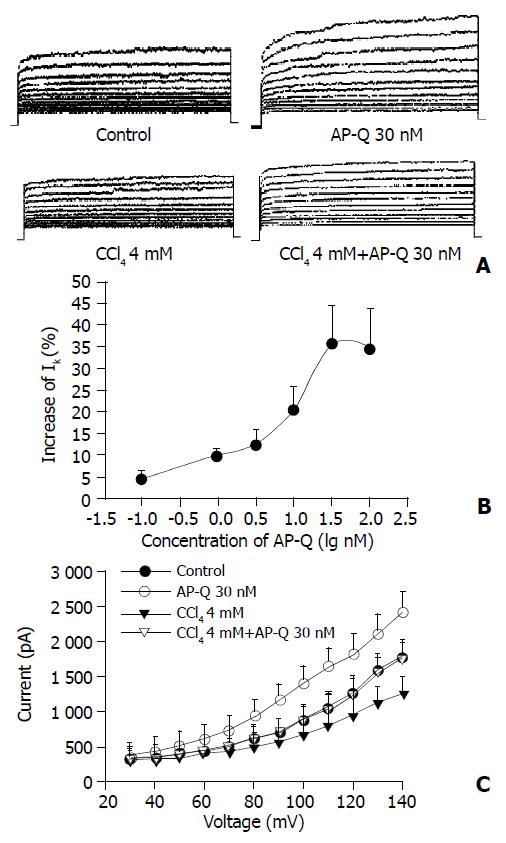
Figure 1 Effects of AP-Q on IK.
A: Family of IK recorded with changes in the absence or presence of AP-Q 30 nM (upper) and family of IK recorded with changes after CCl4 administra-tion in the absence or presence of AP-Q 30 nM (bottom). B: Concentration-response curve for the effects of AP-Q on IK. n=6. C: I-V relationship of IK under control (●), AP-Q 30 nM (○), CCl4 4 mM (▲) and AP-Q 30 nM after CCl4 4 mM administra-tion (△). The voltage steps used to elicit IK are shown in the inset of panel (B). n=6.
- Citation: Zhou HY, Wang F, Zhang KQ, Cheng L, Zhou J, Fu LY, Yao WX. Electrophysiological effects of anthopleurin-Q on rat hepatocytes. World J Gastroenterol 2004; 10(1): 96-99
- URL: https://www.wjgnet.com/1007-9327/full/v10/i1/96.htm
- DOI: https://dx.doi.org/10.3748/wjg.v10.i1.96


