Copyright
©The Author(s) 2004.
World J Gastroenterol. Jan 1, 2004; 10(1): 77-81
Published online Jan 1, 2004. doi: 10.3748/wjg.v10.i1.77
Published online Jan 1, 2004. doi: 10.3748/wjg.v10.i1.77
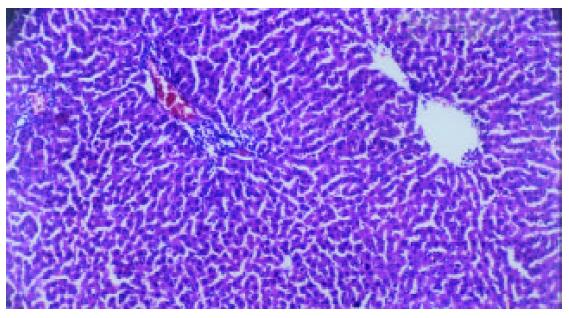
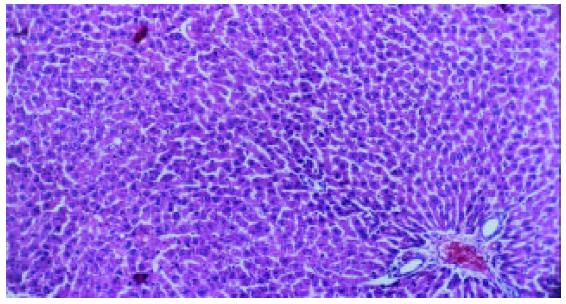
Figure 1 Liver of mormal rat (H-E staining, × 100).
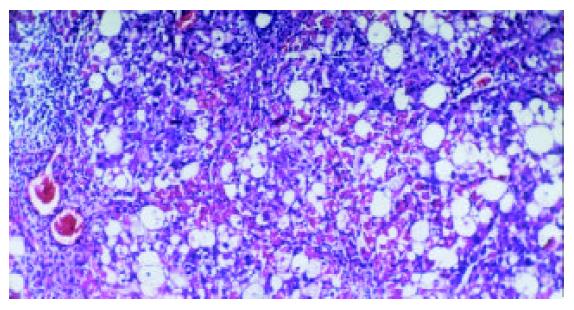
Figure 2 Liver of rats in group C (the fifth week, H-E staining, × 100).
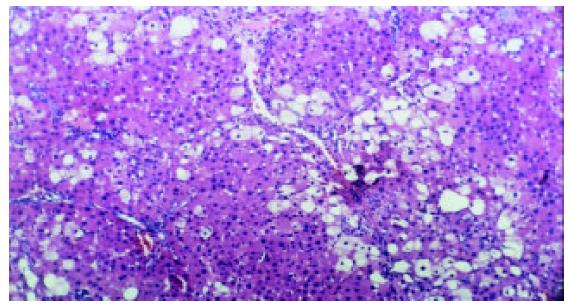
Figure 3 Liver of rats in group C(the seventh week, H-E staining, × 100).
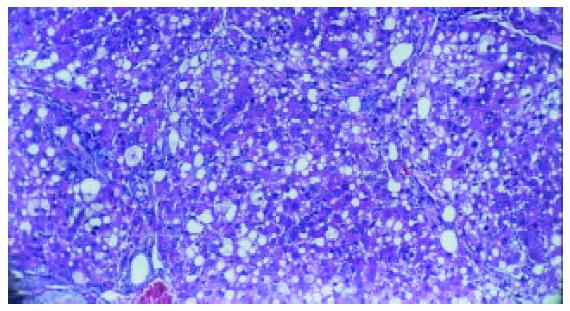
Figure 4 Liver of rats in group C(the ninth week, H-E staining, × 100).
Figure 5 Liver of rats in group E(the ninth week, H-E staining, × 100).
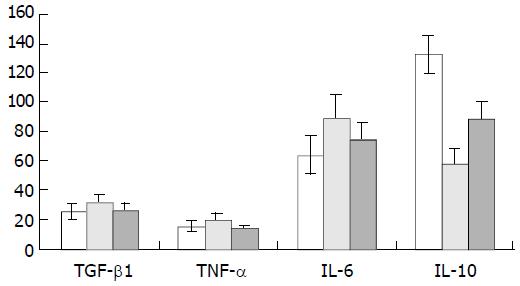
Figure 6 Levels of TGF-β1, TNF-α, IL-6 and IL-10 in serum from control, fibrogenesis and IL-10-intervention groups.
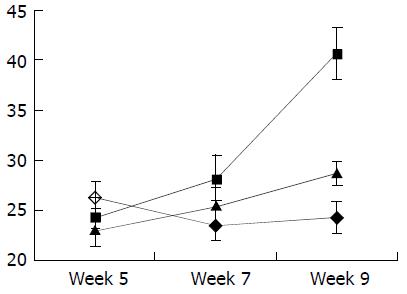
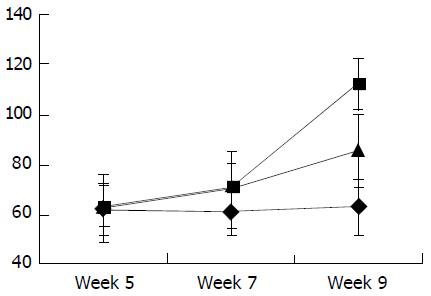
Figure 7 Levels of TGF-β1 in serum from control(-◆-), fibrogenesis(-■-) and IL-10-intervention groups(-▲-).
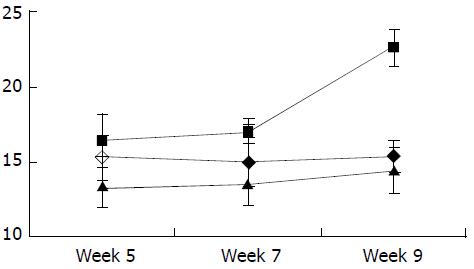
Figure 8 Levels of TNF-α in serum from control(-◆-), fibrogenesis(-■-) and IL-10-intervention groups(-▲-).
Figure 9 Levels of IL-6 in serum from control(-◆-), fibrogenesis(-■-) and IL-10-intervention groups(-▲-).
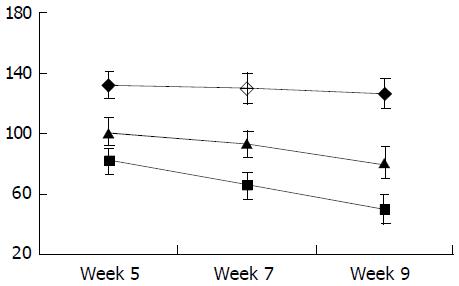
Figure 10 Levels of IL-10 in serum from control(-◆-), fibrogenesis(-■-) and IL-10-intervention groups(-▲-).
- Citation: Zhang LJ, Yu JP, Li D, Huang YH, Chen ZX, Wang XZ. Effects of cytokines on carbon tetrachloride-induced hepatic fibrogenesis in rats. World J Gastroenterol 2004; 10(1): 77-81
- URL: https://www.wjgnet.com/1007-9327/full/v10/i1/77.htm
- DOI: https://dx.doi.org/10.3748/wjg.v10.i1.77


