Copyright
©The Author(s) 2004.
World J Gastroenterol. Jan 1, 2004; 10(1): 37-41
Published online Jan 1, 2004. doi: 10.3748/wjg.v10.i1.37
Published online Jan 1, 2004. doi: 10.3748/wjg.v10.i1.37
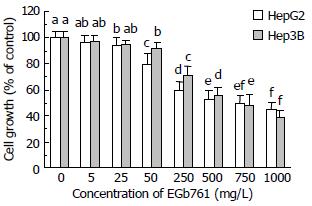
Figure 1 Effects of EGb 761 on cell growth in HepG2 and Hep3B cells measured by MTS assay.
Data are expressed as -χ±s (n = 8). Values not sharing the same letter differed significantly (P < 0.05) in the same cell line by Fisher’s least significant difference test.
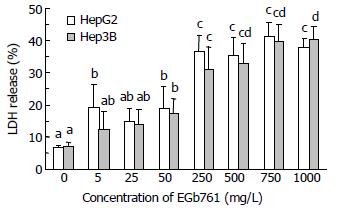
Figure 2 Effects of EGb 761 on cell cytotoxicity in HepG2 and Hep3B cells determined by lactate dehydrogenase (LDH) release.
Data are expressed as -χ±s (n = 3). Values not sharing the same letter differed significantly (P < 0.05) in the same cell line by Fisher’s least significant difference test.
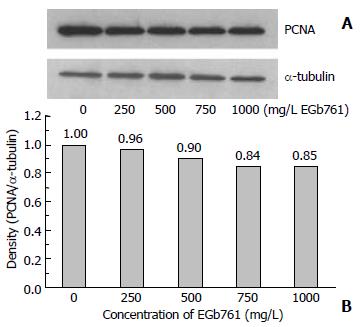
Figure 3 Expression of proliferating cell nuclear antigen (PCNA) with the molecular weight of 36 kDa which was visu-alized by Western blotting (A) and quantitated by an image analysis system (B) after HepG2 cells were incubated with 0-1000 mg/L EGb 761 for 48 h.
Samples were pooled from 6 independent experiments (n = 6). Alpha-tubulin (55 kDa) was as an internal control.
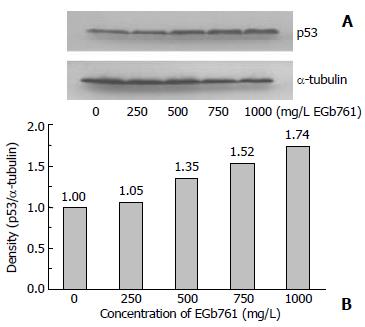
Figure 4 Expression of p53 protein with the molecular weight of 53 kDa which was visualized by Western blotting (A) and quantitated by an image analysis system (B) after HepG2 cells were incubated with 0-1000 mg/L EGb 761 for 48 h.
Samples were pooled from 6 independent experiments (n = 6). Alpha-tubulin (55 kDa) was as an internal control.
- Citation: Chao JC, Chu CC. Effects of Ginkgo biloba extract on cell proliferation and cytotoxicity in human hepatocellular carcinoma cells. World J Gastroenterol 2004; 10(1): 37-41
- URL: https://www.wjgnet.com/1007-9327/full/v10/i1/37.htm
- DOI: https://dx.doi.org/10.3748/wjg.v10.i1.37


