Copyright
©The Author(s) 2004.
World J Gastroenterol. Jan 1, 2004; 10(1): 105-111
Published online Jan 1, 2004. doi: 10.3748/wjg.v10.i1.105
Published online Jan 1, 2004. doi: 10.3748/wjg.v10.i1.105
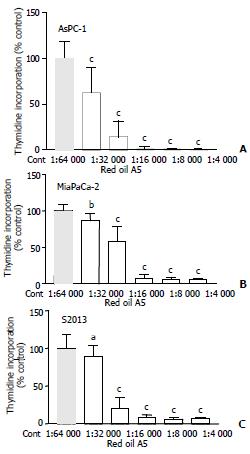
Figure 1 (A,B,C) Effect of different concentrations of red oil A5 on proliferation of three pancreatic cancer cell lines, AsPC-1, MiaPaCa-2 and S2013, as measured by 3H-methyl thymidine incorporation.
Results are expressed as % of control from three separate experiments. aP < 0.05, bP < 0.01, cP < 0.001 vs control.
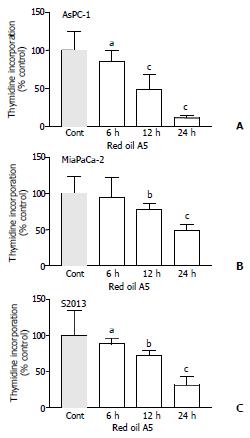
Figure 2 (A,B,C) Time-dependent effects of 1:32 000 red oil A5 on proliferation of three pancreatic cancer cell lines, AsPC-1, MiaPaCa-2 and S2013, as measured by 3H-methyl thymidine incorporation at 6, 12 and 24 hours.
The results are expressed as % of control from three separate experiments. aP < 0.05, bP < 0.01, cP < 0.001 vs control.
Figure 3 (A,B,C) Time-course effects of 1:32 000 red oil A5 on cell number in AsPC-1, MiaPaCa-2 and S2013 cells from 24 to 96 hours.
The data represent mean ± SEM of three separate experiments. aP < 0.05, bP < 0.01, cP < 0.001 vs control.
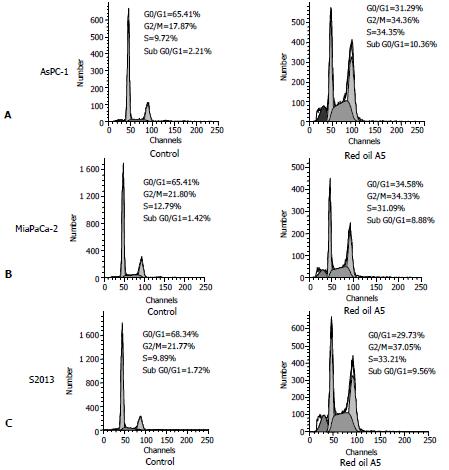
Figure 4 (A,B,C) Flow-cytometric analysis of cellular DNA content in control and red oil A5 treated AsPC-1, MiaPaCa-2 and S2013 cells, stained with propidium iodide.
The cells were treated with 1:32000 red oil A5 in serum-free conditions for 24 hours. The distribution of cell cycle phases is expressed as % of total cells. Results were representative of three separate experiments.
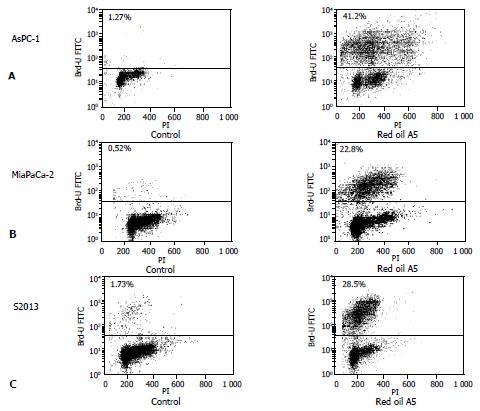
Figure 5 (A,B,C) TUNEL assay of red oil A5-induced pancreatic cancer cell apoptosis.
Dot plot shows TdT-mediated dUTP nick-end labeling of control cells and cells treated with 1:32 000 red oil A5 which is expressed as % of total cells. The increases in fluorescence events in the upper panels are due to UTP labeling of fragmented DNA. The results are representative of three different experiments.
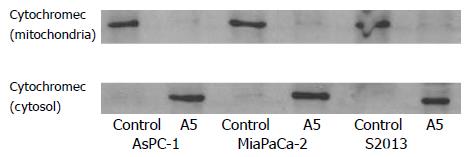
Figure 6 Western blot of the cytochrome c protein in AsPC-1, MiaPaCa-2 and S2013 cells treated with 1:32 000 red oil A5 for 24 hours.
Proteins in cytosolic fraction and in mitochondrial fraction are extracted. Proteins extracted from each sample are electrophoresed on an SDS-PAGE gel and then are transferred to nitrocellulose membranes. Cytochrome c is identified using a monoclonal cytochrome c antibody. The results are repre-sentative of three different experiments.
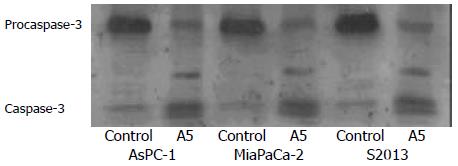
Figure 7 Western blot of the caspase-3 protein in AsPC-1, MiaPaCa-2 and S2013 cells are treated with 1:32 000 red oil A5 for 24 hours.
Proteins in the whole cellular lysates are electro-phoresed on an SDS-PAGE gel and then transferred to nitro-cellulose membranes. Caspase-3 is identified using a specific antibody. The results are representative of three different experiments.
Figure 8 Western blot of poly-ADP ribose polymerase (PARP) protein in AsPC-1, MiaPaCa-2 and S2013 cells are treated with 1:32 000 red oil A5 for 24 hours.
Proteins in whole cellular lysates are separated by electrophoresis on SDS-PAGE gels and then are transferred to nitrocellulose membranes. PARP is iden-tified using a monoclonal antibody. The results are represen-tative of three different experiments.
- Citation: Dong ML, Ding XZ, Adrian TE. Red oil A5 inhibits proliferation and induces apoptosis in pancreatic cancer cells. World J Gastroenterol 2004; 10(1): 105-111
- URL: https://www.wjgnet.com/1007-9327/full/v10/i1/105.htm
- DOI: https://dx.doi.org/10.3748/wjg.v10.i1.105


