
















Copyright: ©Author(s) 2026.
World J Meta-Anal. Jun 18, 2026; 14(2): 119849
Published online Jun 18, 2026. doi: 10.13105/wjma.v14.i2.119849
Published online Jun 18, 2026. doi: 10.13105/wjma.v14.i2.119849
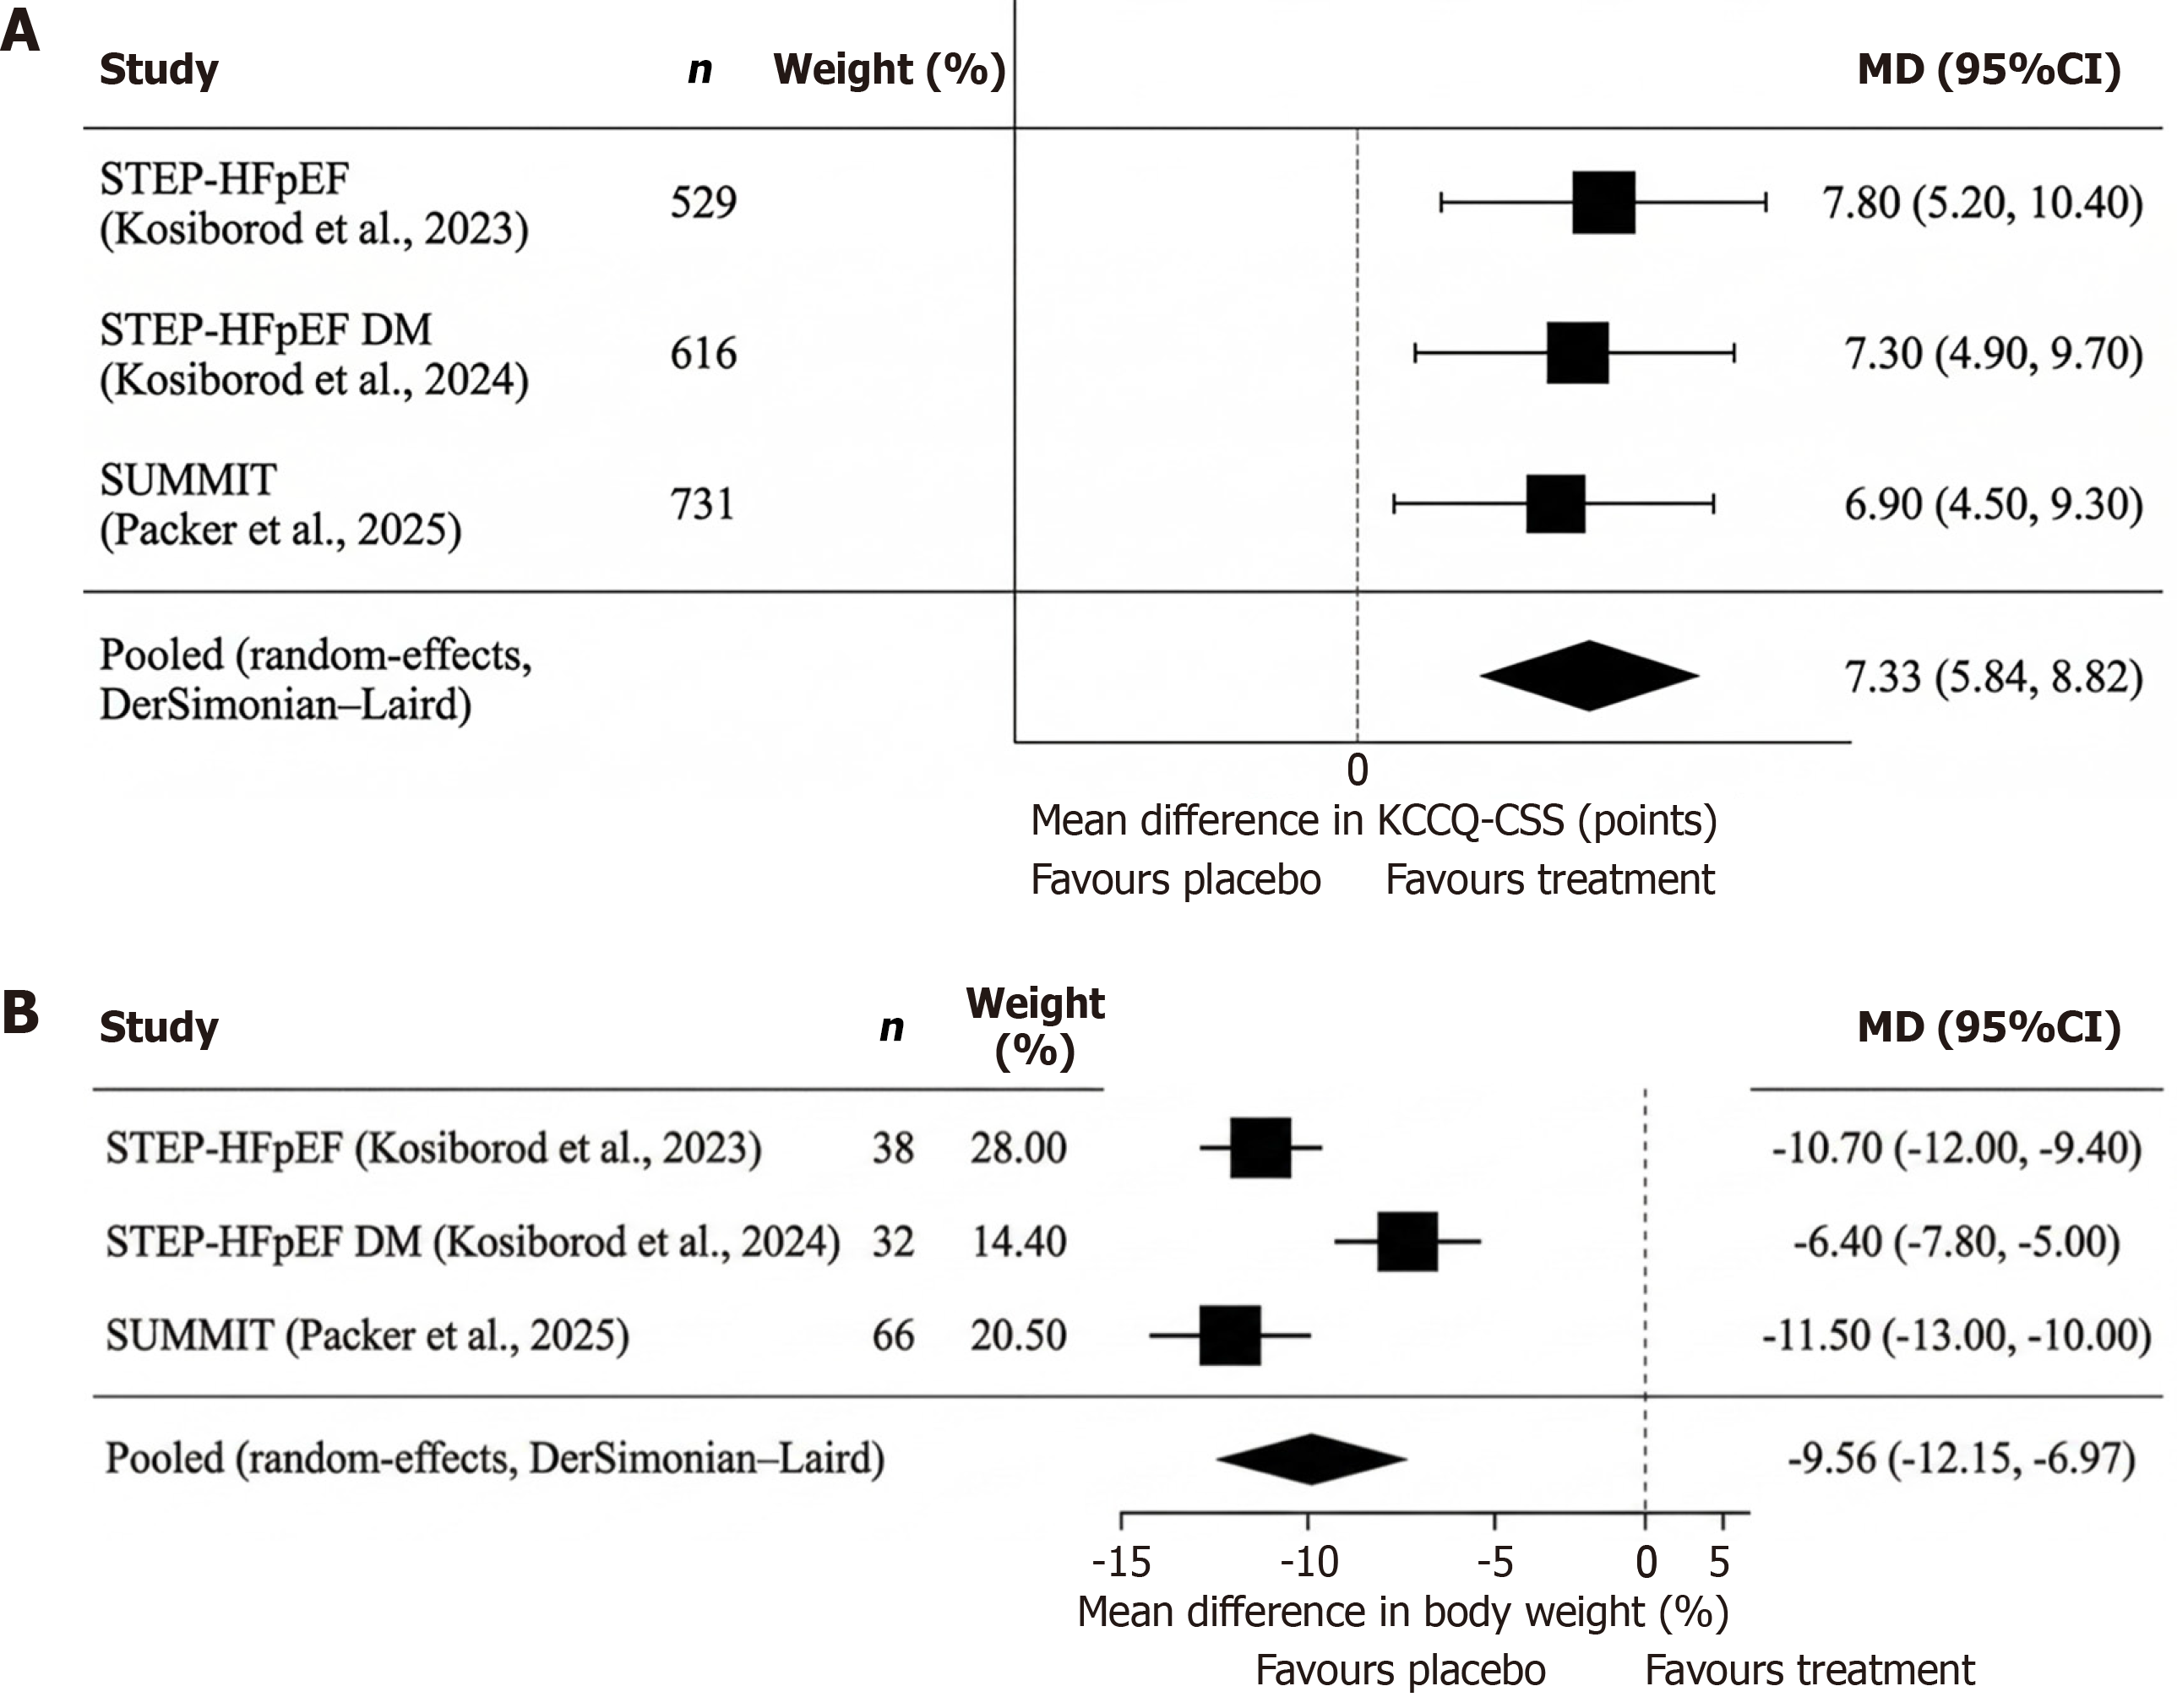
Figure 3 Effects of semaglutide on clinical status and body weight in patients with heart failure with preserved ejection fraction.
A: Forest plot showing the mean difference in Kansas City Cardiomyopathy Questionnaire Clinical Summary Score (KCCQ-CSS) between semaglutide and placebo groups across included trials (STEP-HFpEF, STEP-HFpEF DM, and SUMMIT). Squares represent the effect size for each study, with horizontal lines indicating the 95% confidence interval (CI). The diamond represents the pooled effect estimate using a random-effects model. Positive values indicate improvement favoring semaglutide; B: Forest plot demonstrating percentage body weight reduction between semaglutide and placebo groups in the included trials. Squares indicate individual study estimates and horizontal lines represent the 95%CI. The diamond represents the pooled estimate derived from a random-effects model. Negative values indicate greater weight reduction favoring semaglutide. Random-effects model (DerSimonian & Laird). P = 0% indicates no statistical heterogeneity. I2 = 58% indicates moderate heterogeneity, driven by attenuated weight loss in the diabetic cohort (STEP-HFpEF DM). MD: Mean difference in percentage body weight change (treatment minus placebo). Random-effects model (DerSimonian & Laird). Pooled 95%CI reflects between study variance (tau2) consistent with observed heterogeneity. CI: Confidence interval; KCCQ-CSS: Kansas City Cardiomyopathy Questionnaire Clinical Summary Score; HFpEF: Heart failure with preserved ejection fraction.
- Citation: Al Mashtoub E, Hteit A, Bedran A, Al Banna J, El Hachem C, Obeid N, Msheik M, Tlais M, Abdulaal R. Glucagon-like peptide-1-based incretin agonists in obesity-related heart failure with preserved ejection fraction: A systematic review and meta-analysis. World J Meta-Anal 2026; 14(2): 119849
- URL: https://www.wjgnet.com/2308-3840/full/v14/i2/119849.htm
- DOI: https://dx.doi.org/10.13105/wjma.v14.i2.119849