Copyright
©The Author(s) 2021.
World J Meta-Anal. Dec 28, 2021; 9(6): 568-584
Published online Dec 28, 2021. doi: 10.13105/wjma.v9.i6.568
Published online Dec 28, 2021. doi: 10.13105/wjma.v9.i6.568
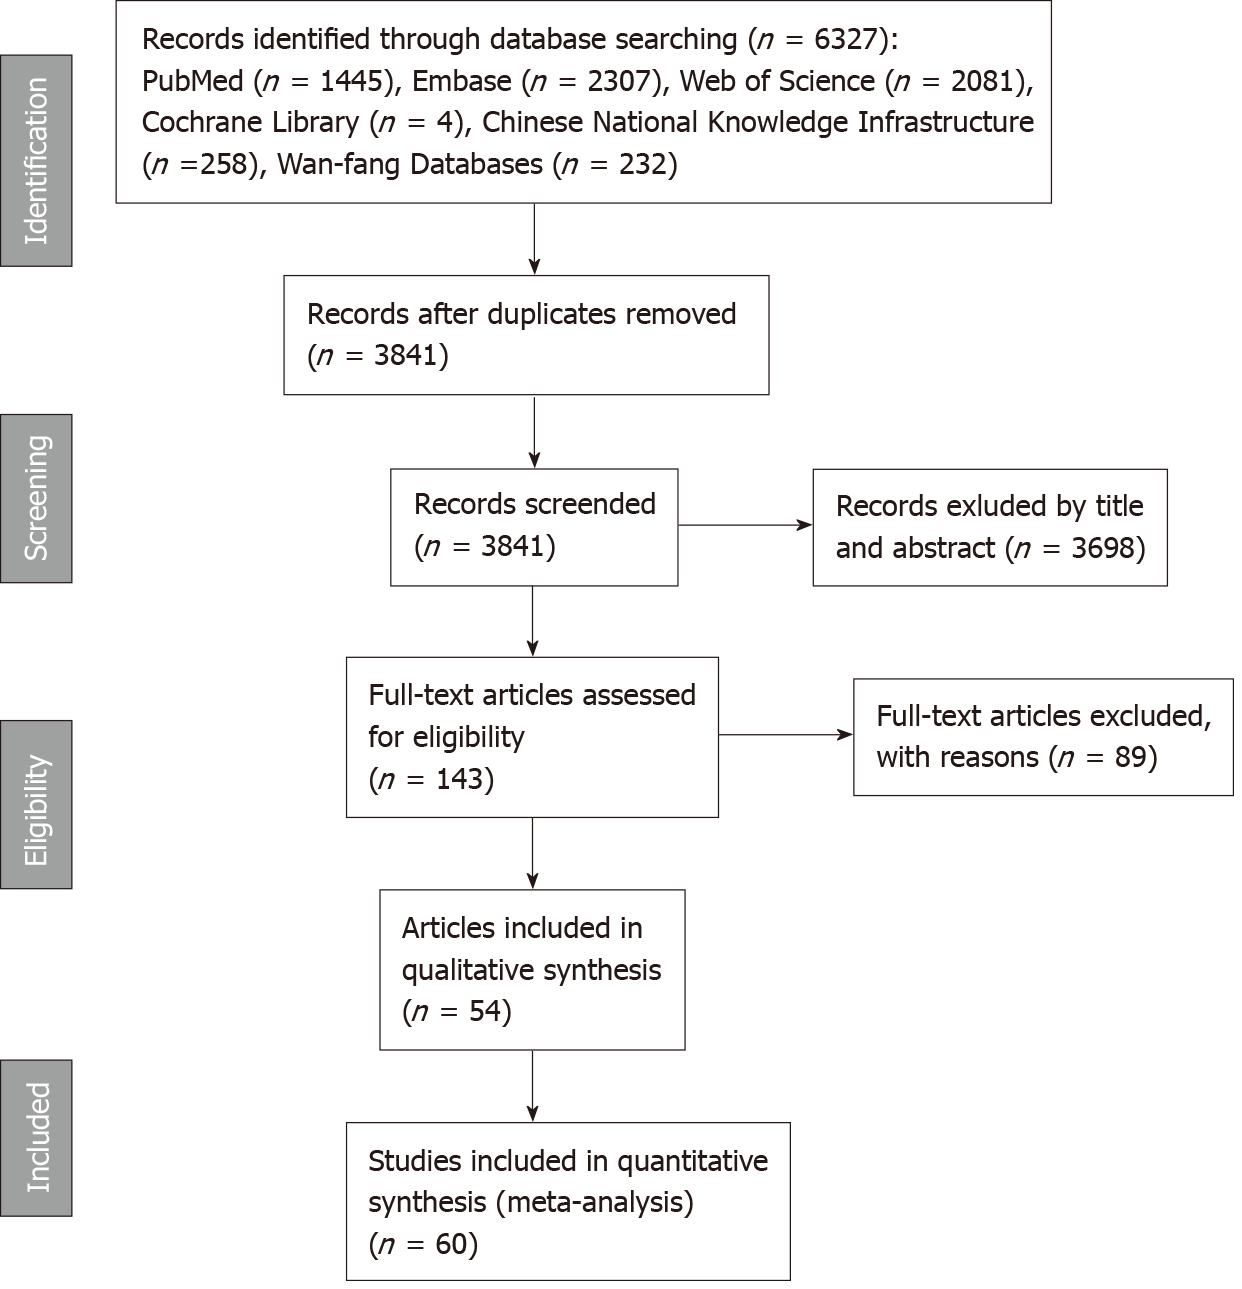
Figure 1 The flow chart of this meta-analysis to identify inclusion studies.
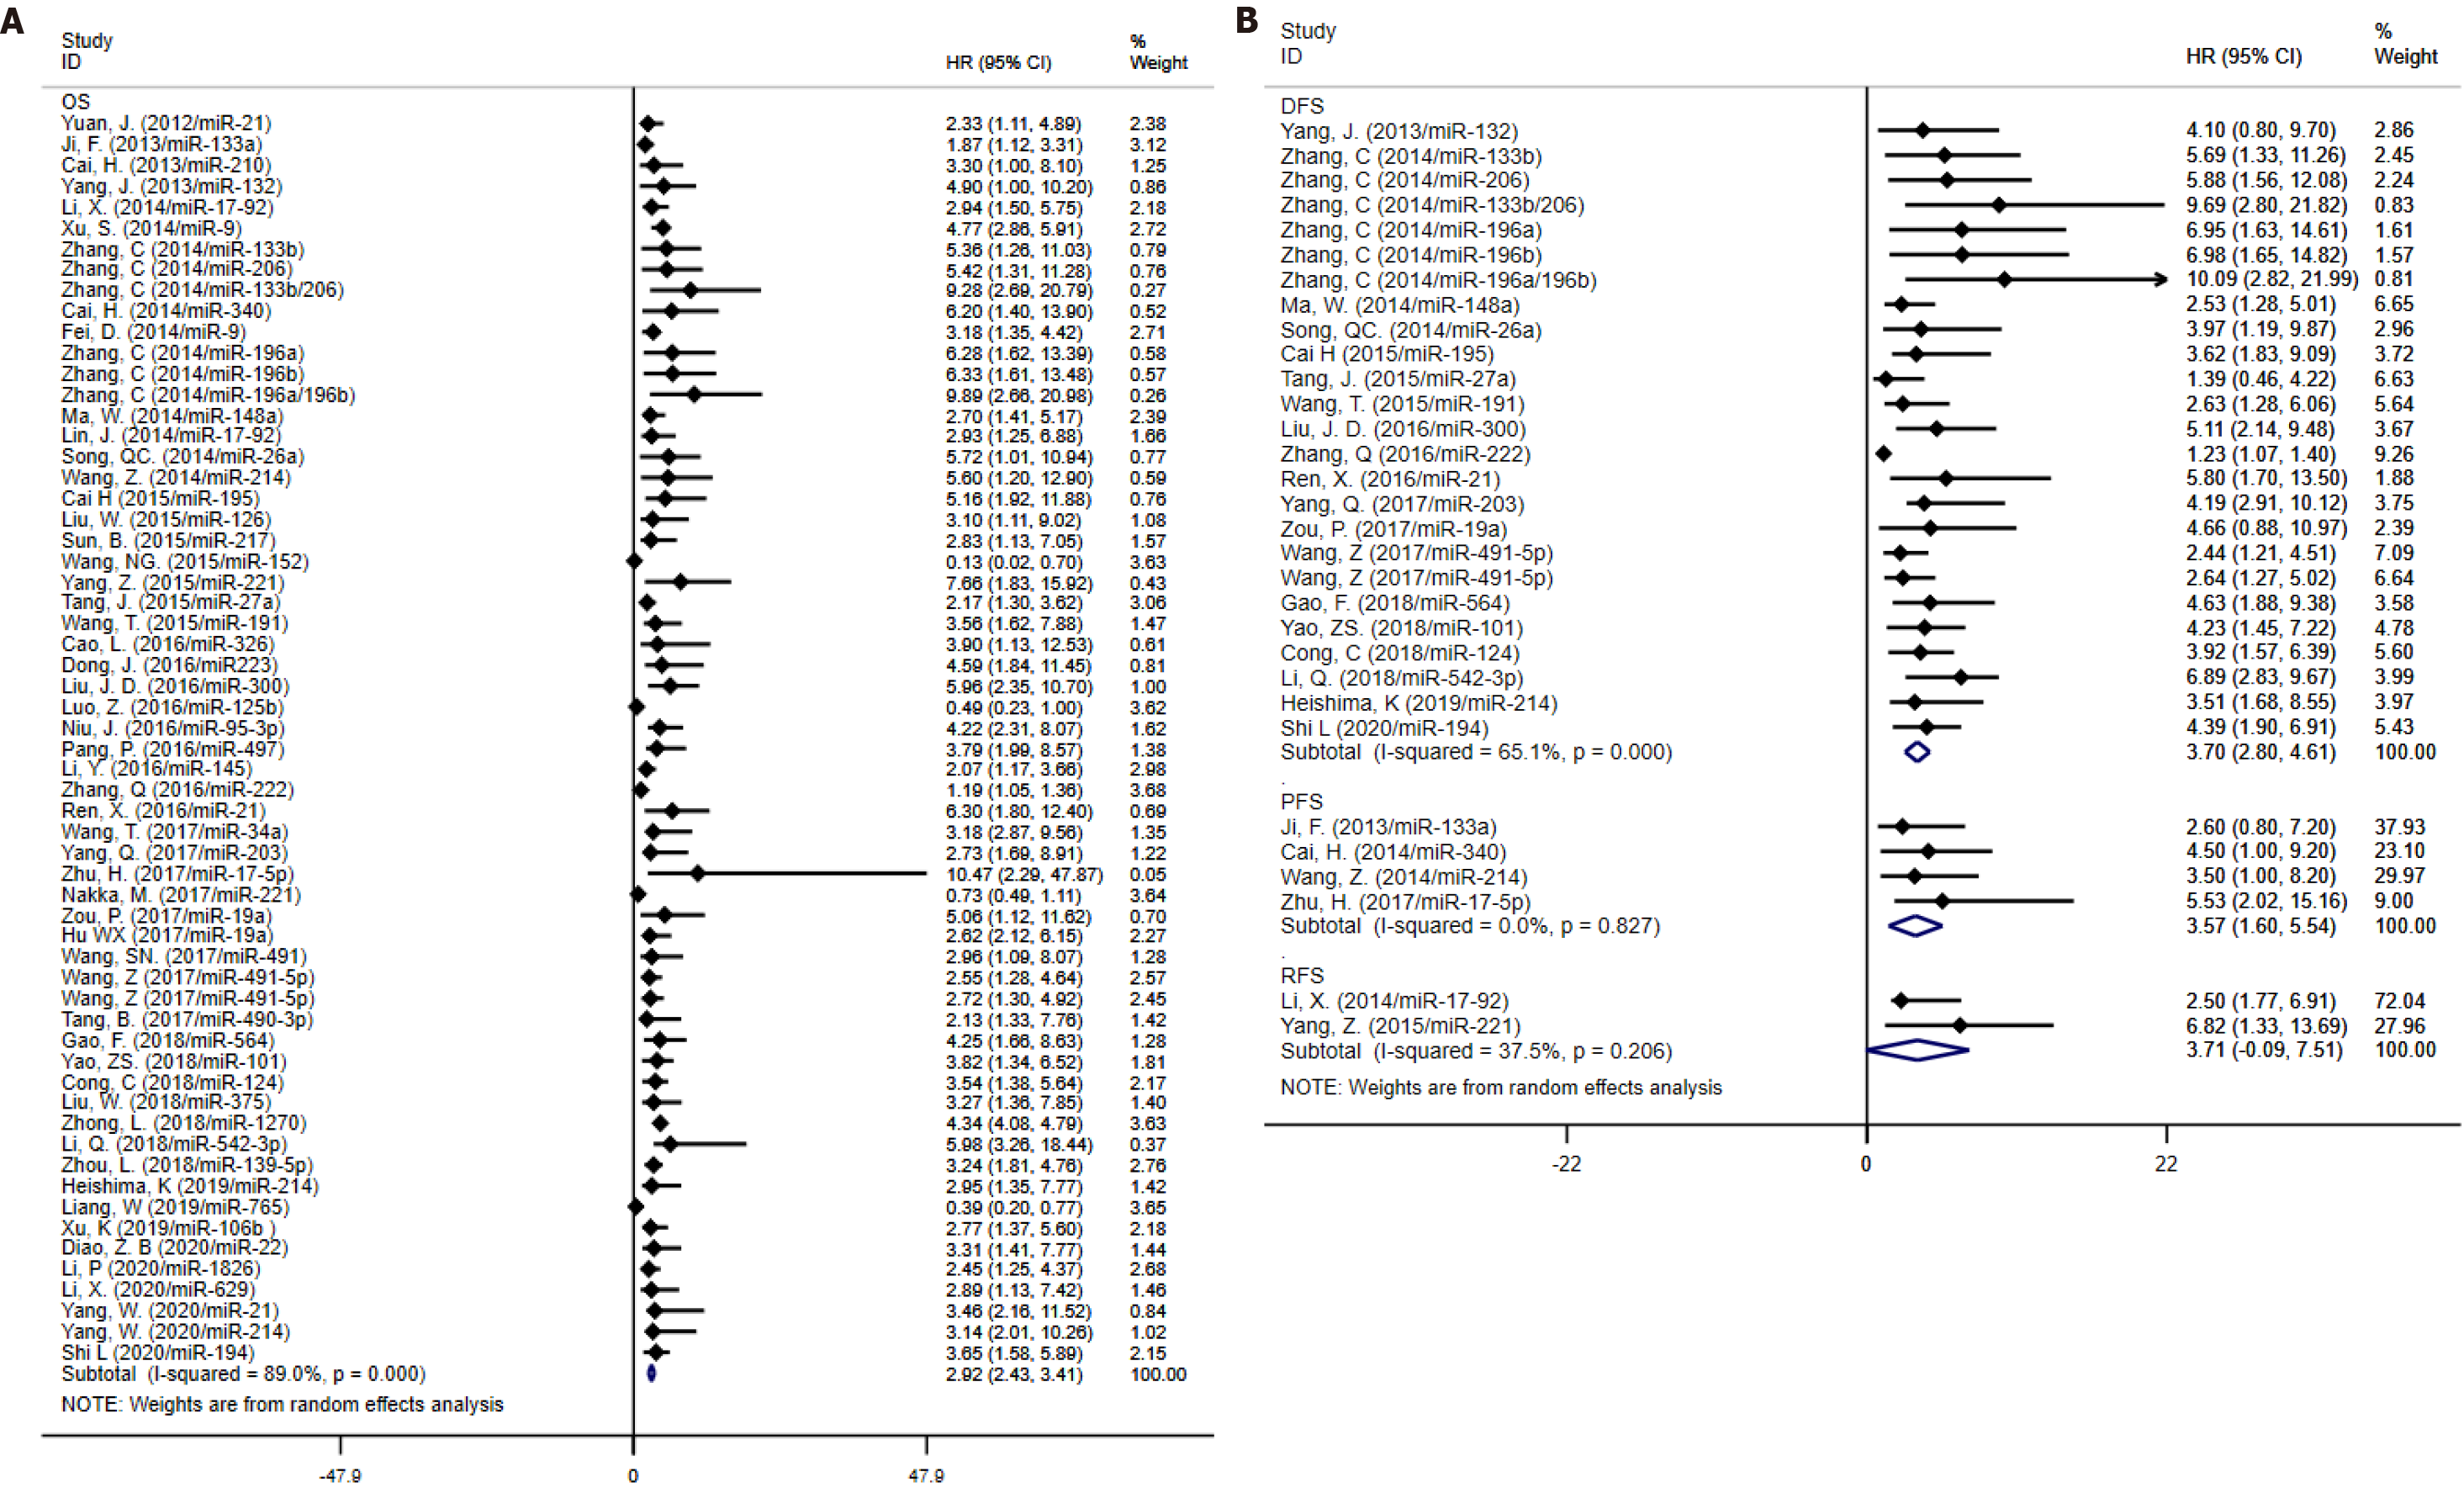
Figure 2 Forest plots for the microRNAs associated with clinical outcome.
A: Forest plots for the microRNA (miRNA) associated with overall survival; B: Forest plots for the miRNAs associated with disease-free survival, progression-free survival and recurrence-free survival.
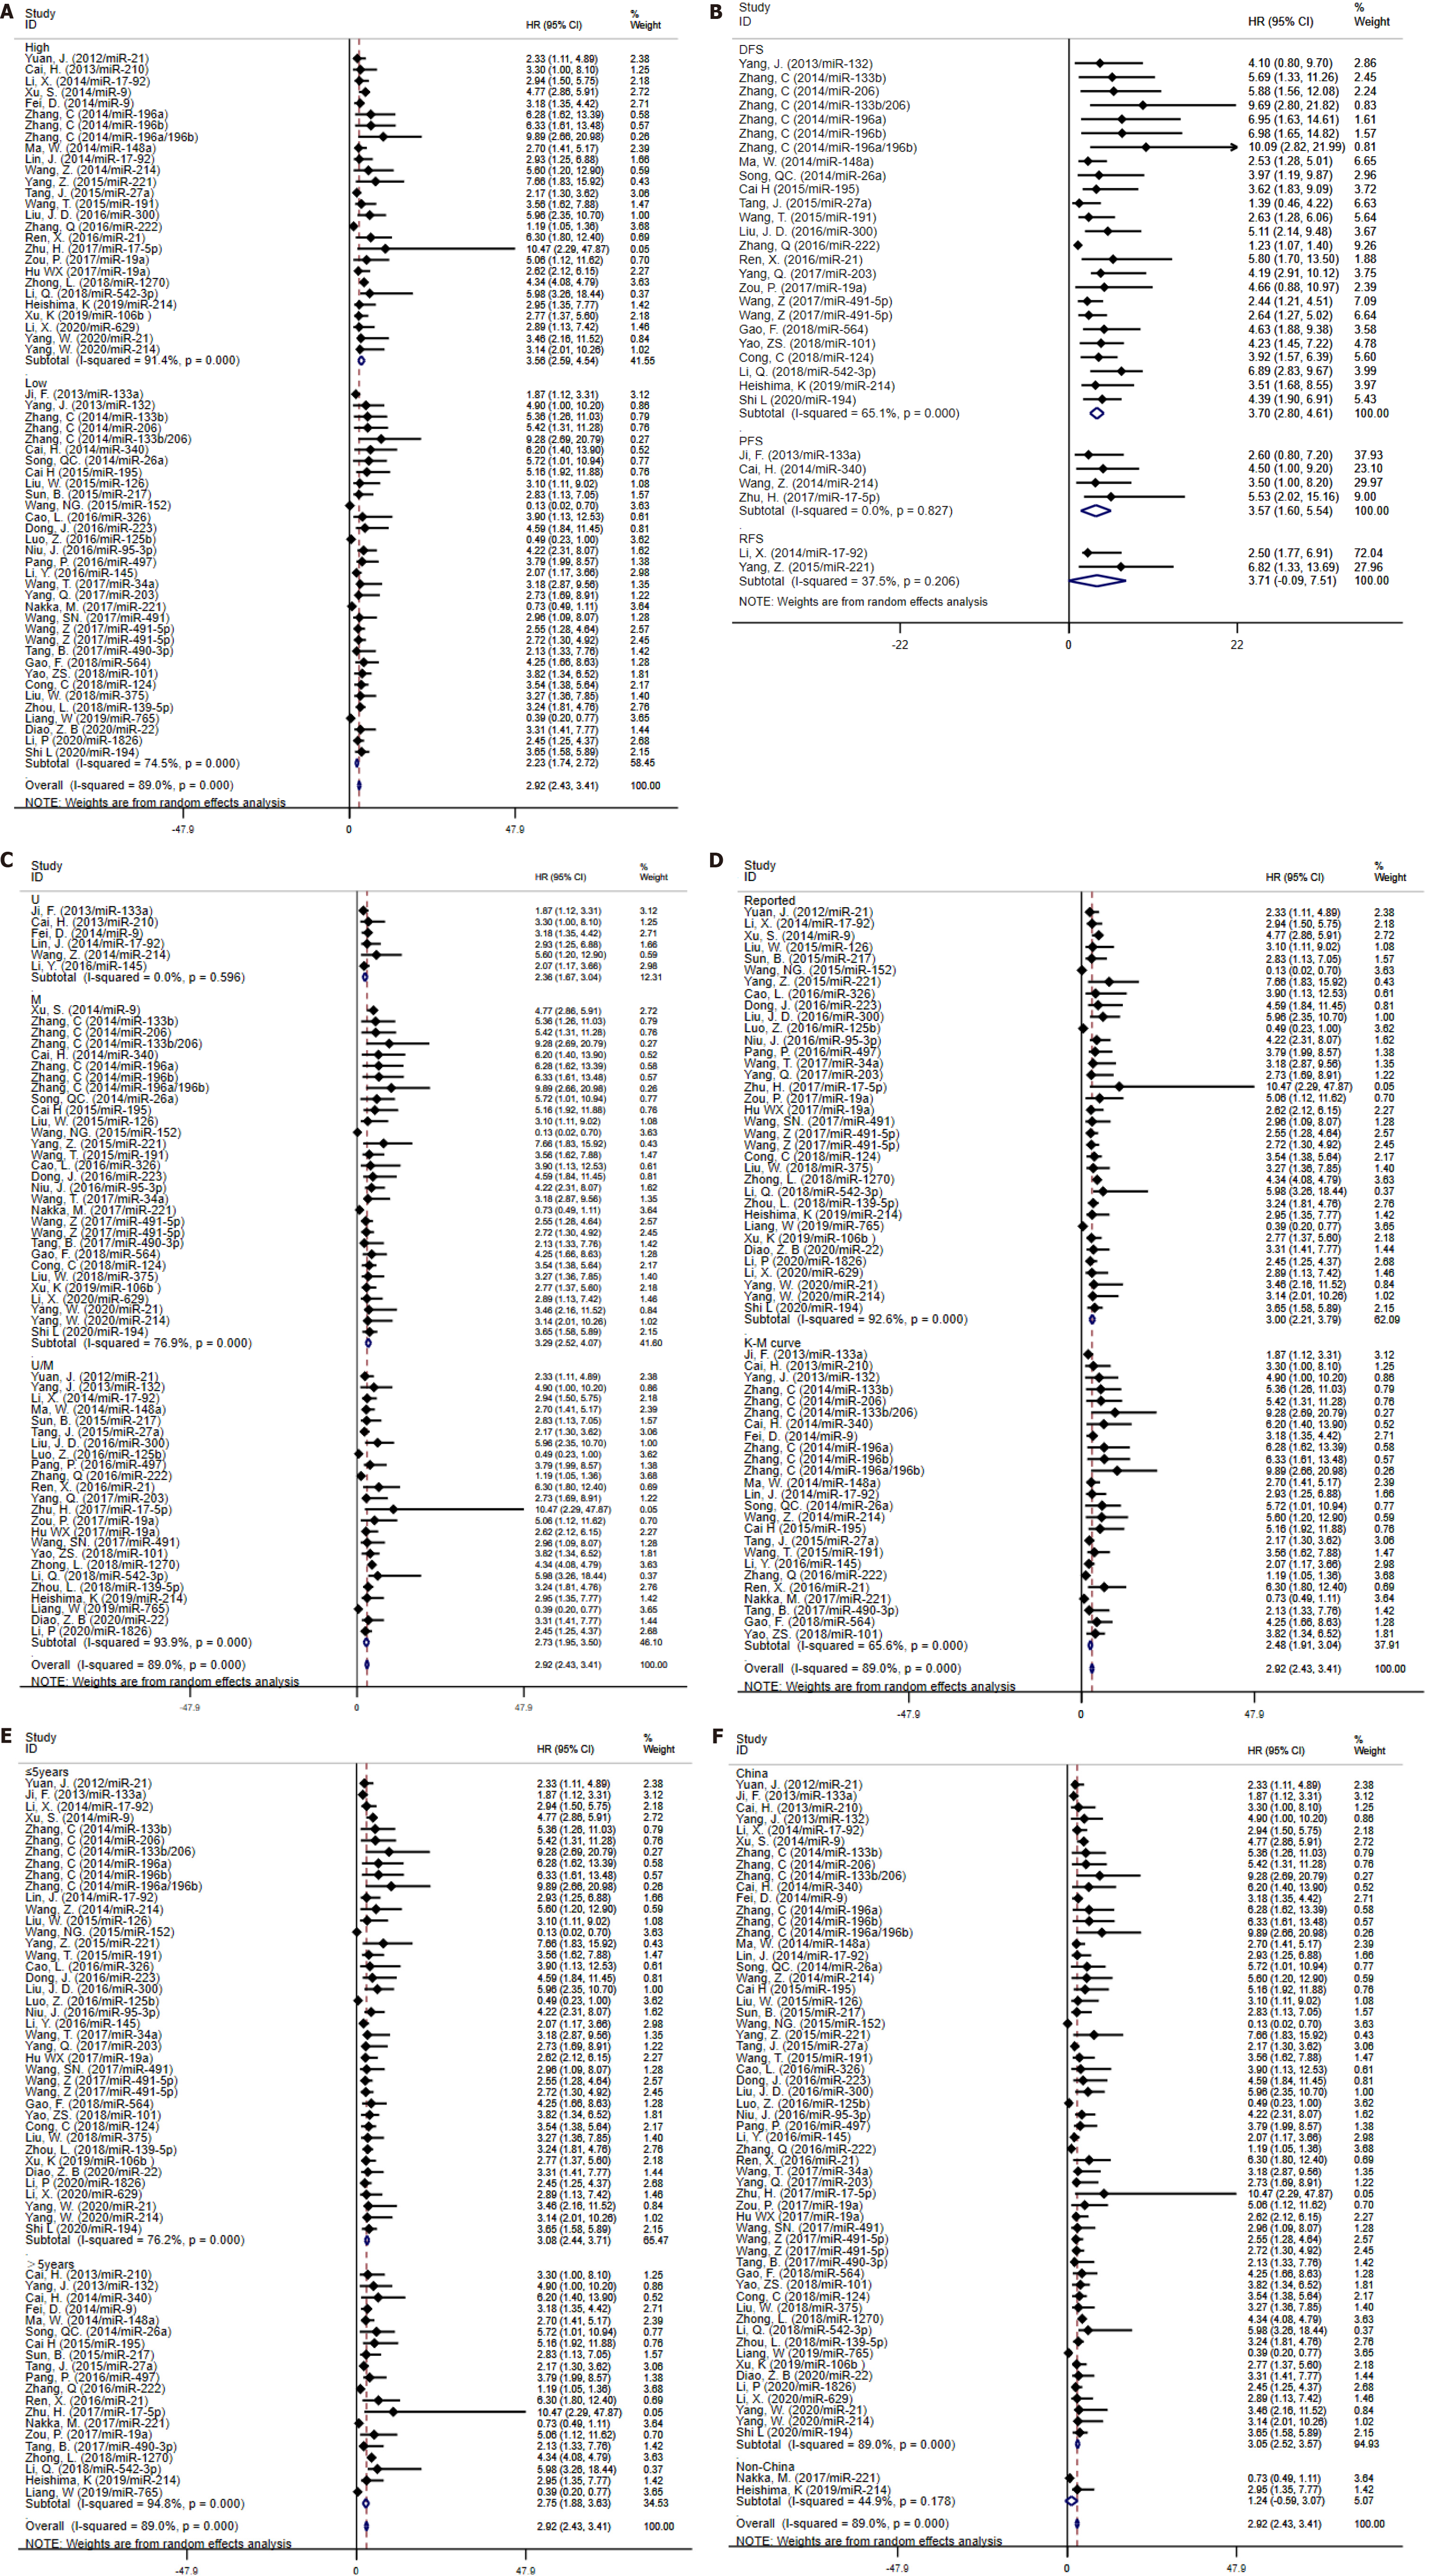
Figure 3 Forest plot of subgroup analysis.
A: Subgroup analysis based on microRNA expression; B: Subgroup analysis based on specimen type; C: Subgroup analysis based on survival analysis; D: Subgroup analysis based on source of hazard ratio; E: Subgroup analysis based on follow-up; F: Subgroup analysis based on country of publication.
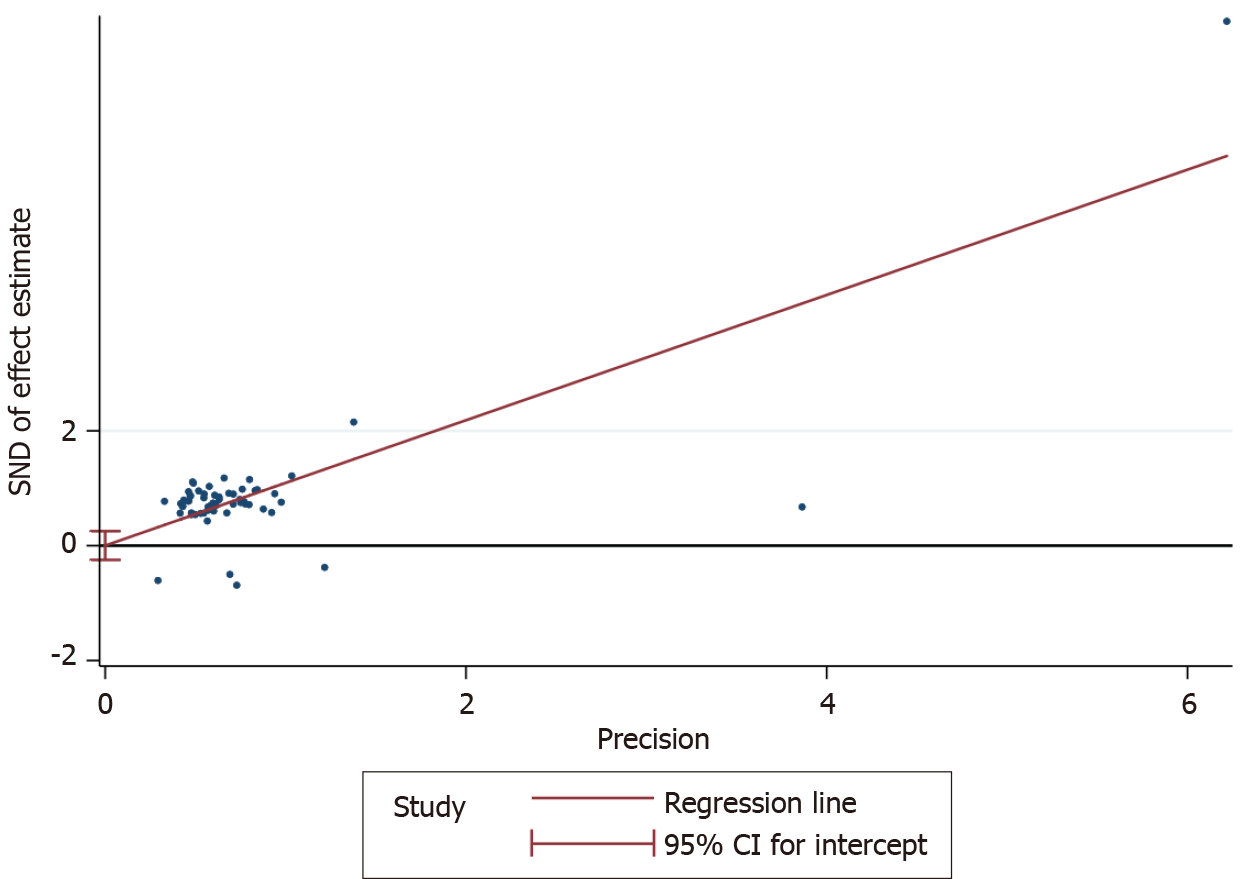
Figure 4 Egger’s test of publication bias.
- Citation: Gao SS, Zhang GX, Zhang WT. MicroRNAs as prognostic biomarkers for survival outcome in osteosarcoma: A meta-analysis. World J Meta-Anal 2021; 9(6): 568-584
- URL: https://www.wjgnet.com/2308-3840/full/v9/i6/568.htm
- DOI: https://dx.doi.org/10.13105/wjma.v9.i6.568


