Copyright
©2014 Baishideng Publishing Group Co.
World J Meta-Anal. Feb 26, 2014; 2(1): 1-16
Published online Feb 26, 2014. doi: 10.13105/wjma.v2.i1.1
Published online Feb 26, 2014. doi: 10.13105/wjma.v2.i1.1
Figure 1 Metaiodobenzylguanidine imaging protocol including planar and single-photon emission computed tomography images obtained 15 to 30 min (early) and 3 to 4 h (late) after intravenous injection of 111 to 370 MBq of 123I-metaiodobenzylguanidine.
MIBG: Metaiodobenzylguanidine.
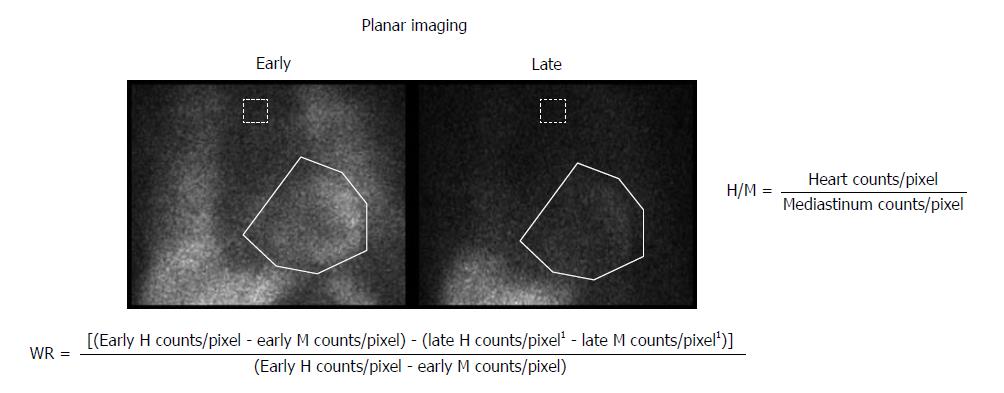
Figure 2 Planar metaiodobenzylguanidine imaging with calculation of heart to mediastinum ratio and washout rate after drawing regions of interest over the heart (solid line) and mediastinum (dotted line).
H/M: Heart-to-mediastinum; WR: Washout rate. 1Decay corrected.
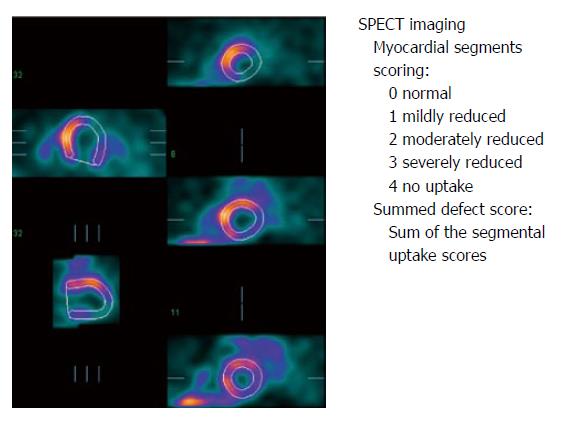
Figure 3 Single-photon emission computed tomography metaiodobenzylguanidine imaging with construction of myocardial polar maps and assessment of innervation defect extent and severity.
SPECT: Single-photon emission computed tomography.
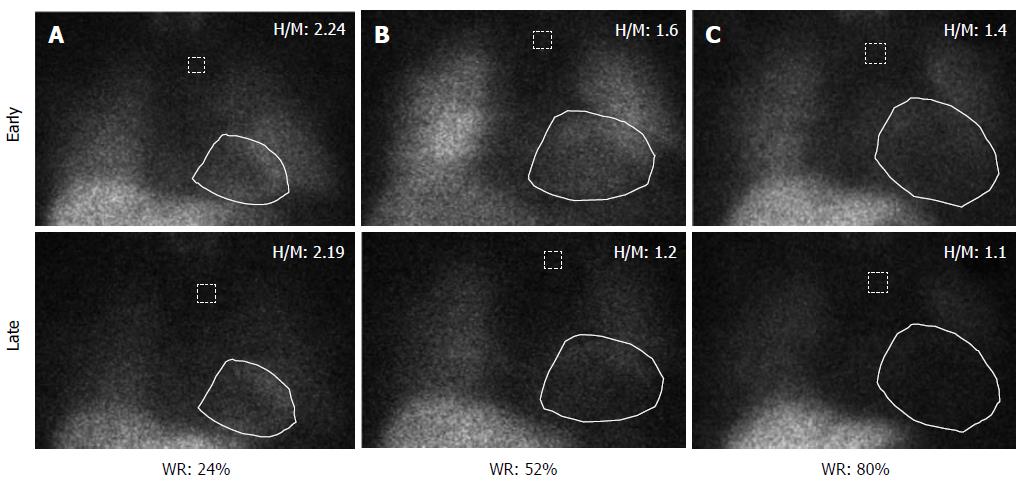
Figure 4 Early and late planar metaiodobenzylguanidine imaging.
A: Control subject; B: Patient with moderate heart failure; C: Patient with severe heart failure. H/M: Heart-to-mediastinum; WR: Washout rate.
- Citation: Petretta M, Petretta A, Pellegrino T, Nappi C, Cantoni V, Cuocolo A. Role of nuclear cardiology for guiding device therapy in patients with heart failure. World J Meta-Anal 2014; 2(1): 1-16
- URL: https://www.wjgnet.com/2308-3840/full/v2/i1/1.htm
- DOI: https://dx.doi.org/10.13105/wjma.v2.i1.1


