Copyright
©The Author(s) 2021.
World J Clin Cases. Oct 26, 2021; 9(30): 8985-8998
Published online Oct 26, 2021. doi: 10.12998/wjcc.v9.i30.8985
Published online Oct 26, 2021. doi: 10.12998/wjcc.v9.i30.8985
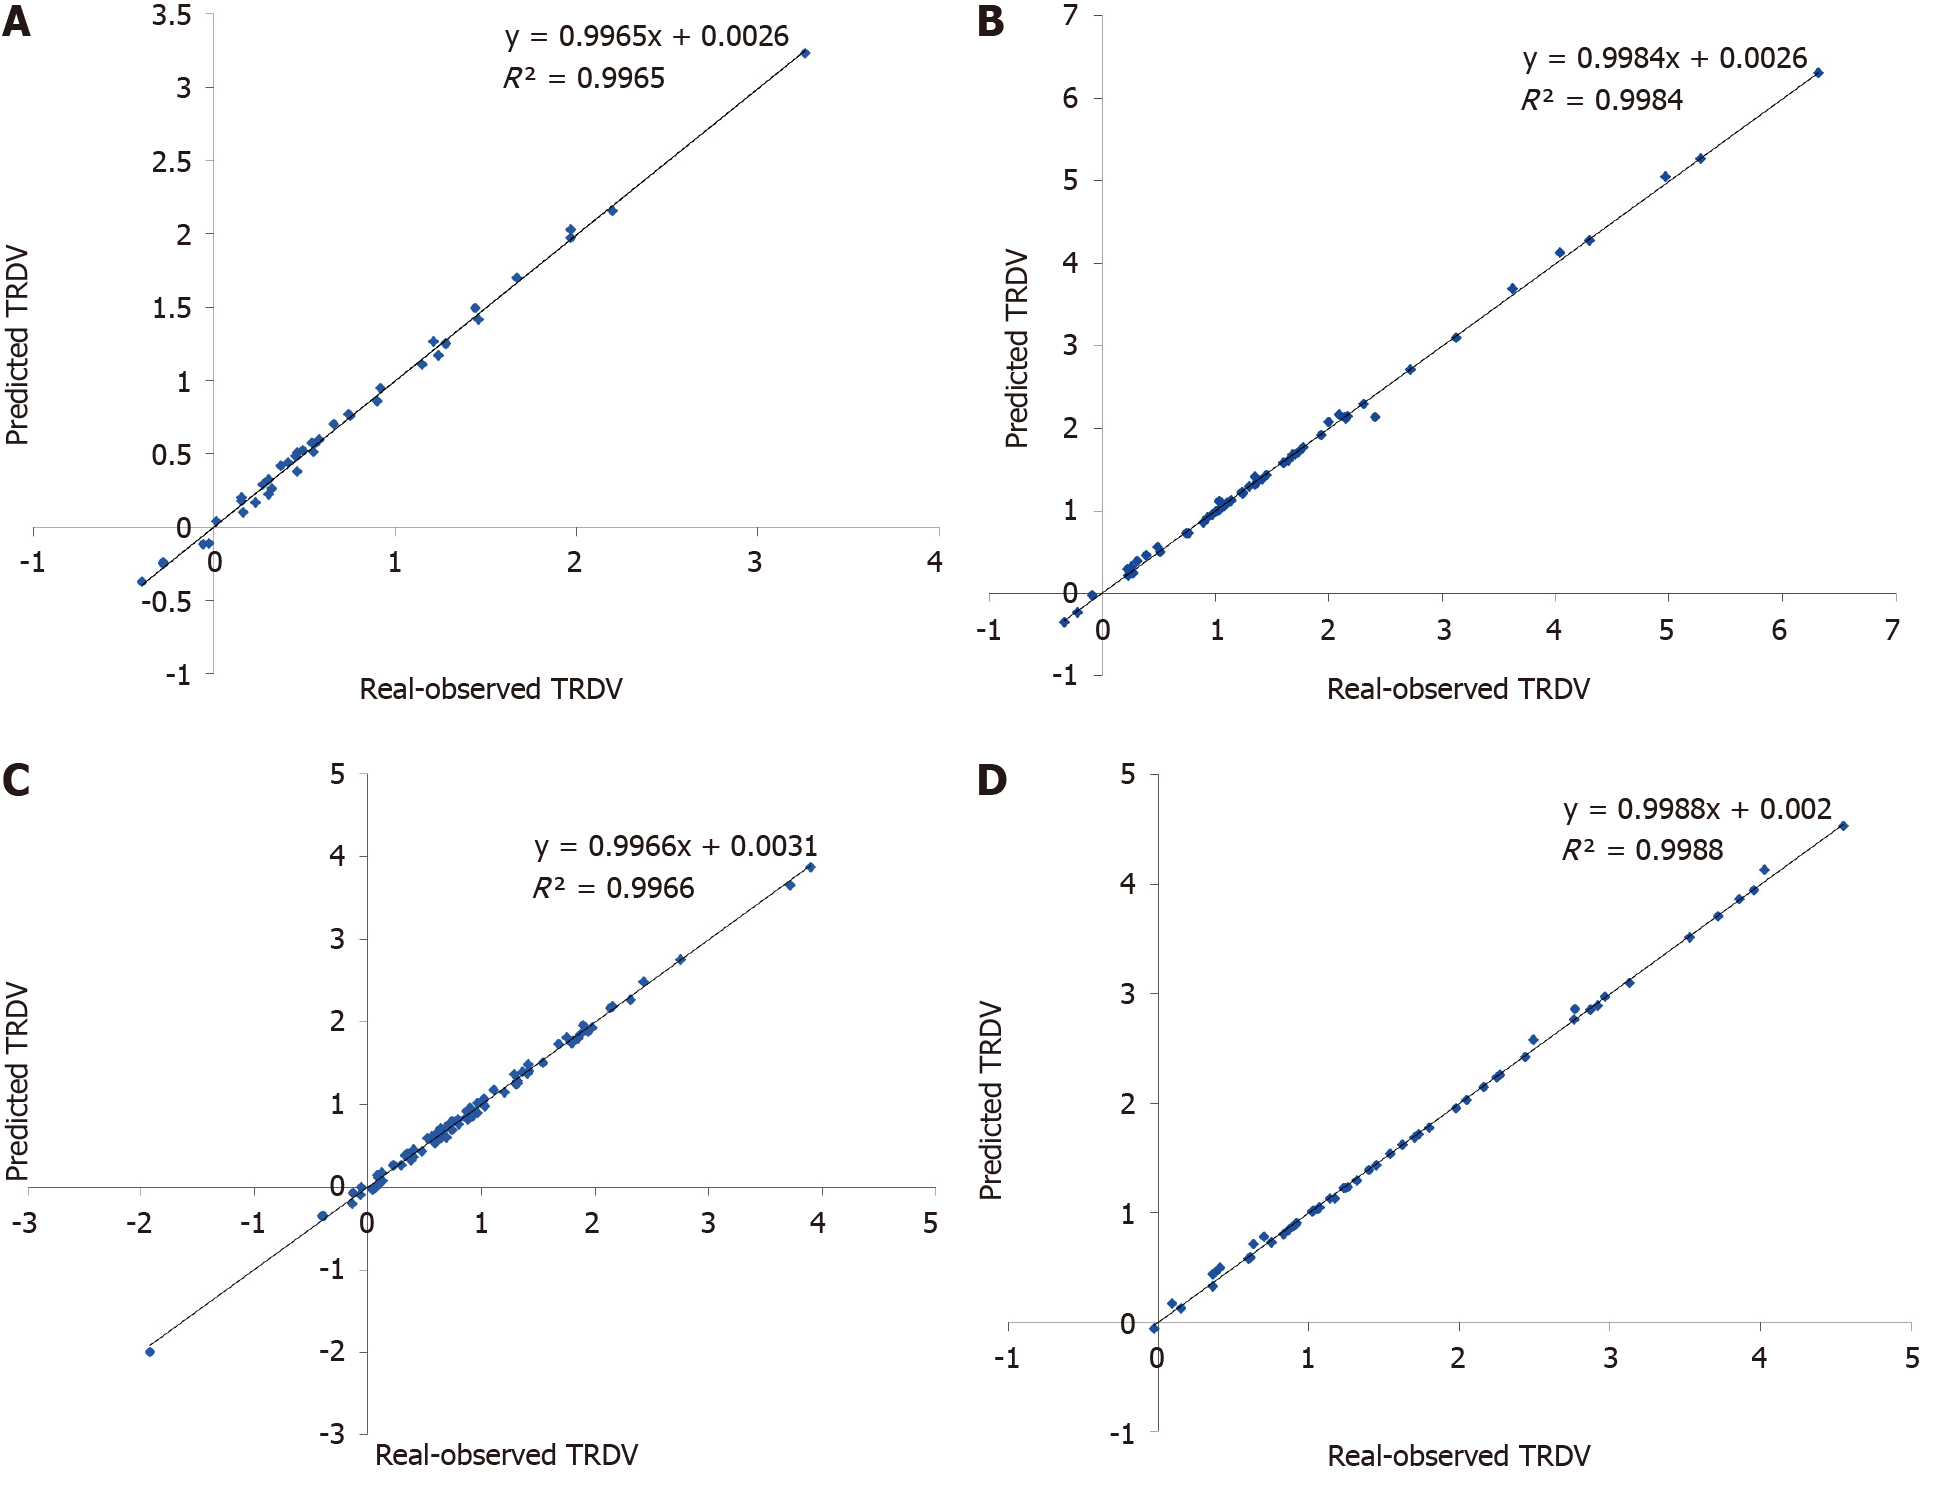
Figure 6 Scatterplots showing the relationship between the predicted value and real-observed total retinal defocus value.
A: Linear regression between predicted total retinal defocus value (TRDV) and observed value low-degree myopia patients of Group A; B: Linear regression between predicted TRDV and observed value low-degree myopia patients of Group B; C: Linear regression between predicted TRDV and observed value moderate-degree myopia patients of Group A; D: Linear regression between predicted TRDV and observed value moderate-degree myopia patients of Group B. TRDV: Total retinal defocus value.
- Citation: Ni NJ, Ma FY, Wu XM, Liu X, Zhang HY, Yu YF, Guo MC, Zhu SY. Novel application of multispectral refraction topography in the observation of myopic control effect by orthokeratology lens in adolescents. World J Clin Cases 2021; 9(30): 8985-8998
- URL: https://www.wjgnet.com/2307-8960/full/v9/i30/8985.htm
- DOI: https://dx.doi.org/10.12998/wjcc.v9.i30.8985


