Copyright
©The Author(s) 2021.
World J Clin Cases. Oct 26, 2021; 9(30): 8985-8998
Published online Oct 26, 2021. doi: 10.12998/wjcc.v9.i30.8985
Published online Oct 26, 2021. doi: 10.12998/wjcc.v9.i30.8985
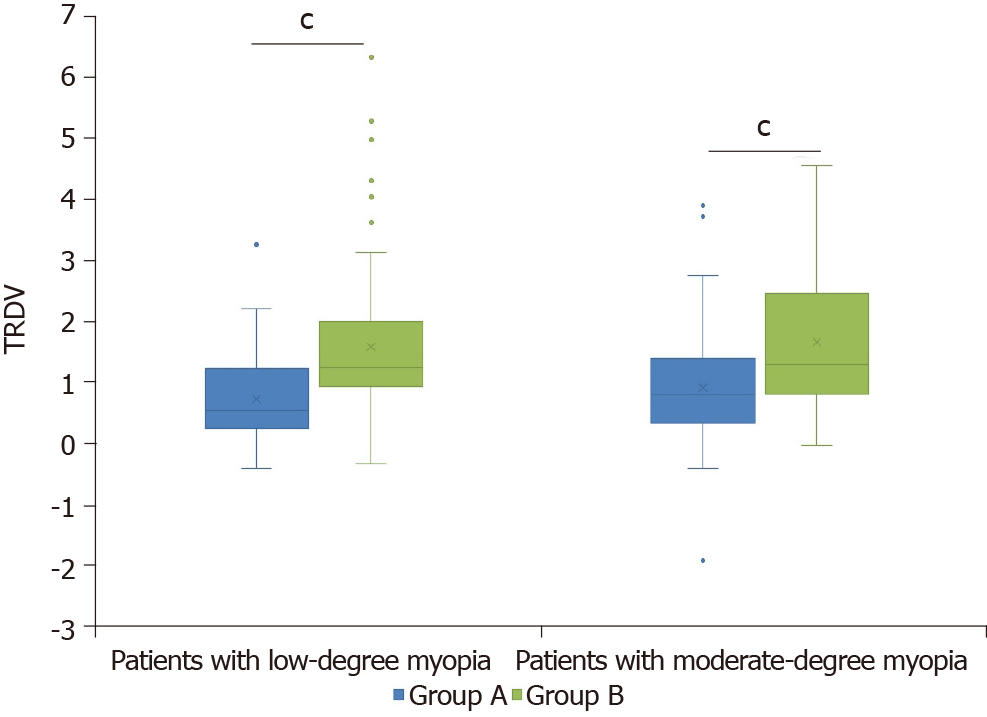
Figure 3 Comparison of total retinal defocus value in the two groups.
Patients with low-degree myopia: Group A: n = 41, mean ± SD = 0.73 ± 0.75; Group B: n = 59, mean ± SD = 1.58 ± 1.31. Patients with moderate -degree myopia: Group A: n = 83, mean ± SD = 0.91 ± 0.89; Group B: n = 54, mean ± SD = 1.66 ± 1.15. Boxes indicate the 1st, 2nd, and 3rd quartile, respectively, whiskers represent the maximum and minimum value, and x indicate mean value. Statistically significant differences between patients treated differently were determined by a Mann-Whitney test (cP ≤ 0.001). TRDV: Total retinal defocus value; Group A: Myopia patients wearing orthokeratology lenses for 1 year; Group B: Myopia patients wearing frame glasses.
- Citation: Ni NJ, Ma FY, Wu XM, Liu X, Zhang HY, Yu YF, Guo MC, Zhu SY. Novel application of multispectral refraction topography in the observation of myopic control effect by orthokeratology lens in adolescents. World J Clin Cases 2021; 9(30): 8985-8998
- URL: https://www.wjgnet.com/2307-8960/full/v9/i30/8985.htm
- DOI: https://dx.doi.org/10.12998/wjcc.v9.i30.8985


