Copyright
©The Author(s) 2021.
World J Clin Cases. Apr 16, 2021; 9(11): 2584-2594
Published online Apr 16, 2021. doi: 10.12998/wjcc.v9.i11.2584
Published online Apr 16, 2021. doi: 10.12998/wjcc.v9.i11.2584
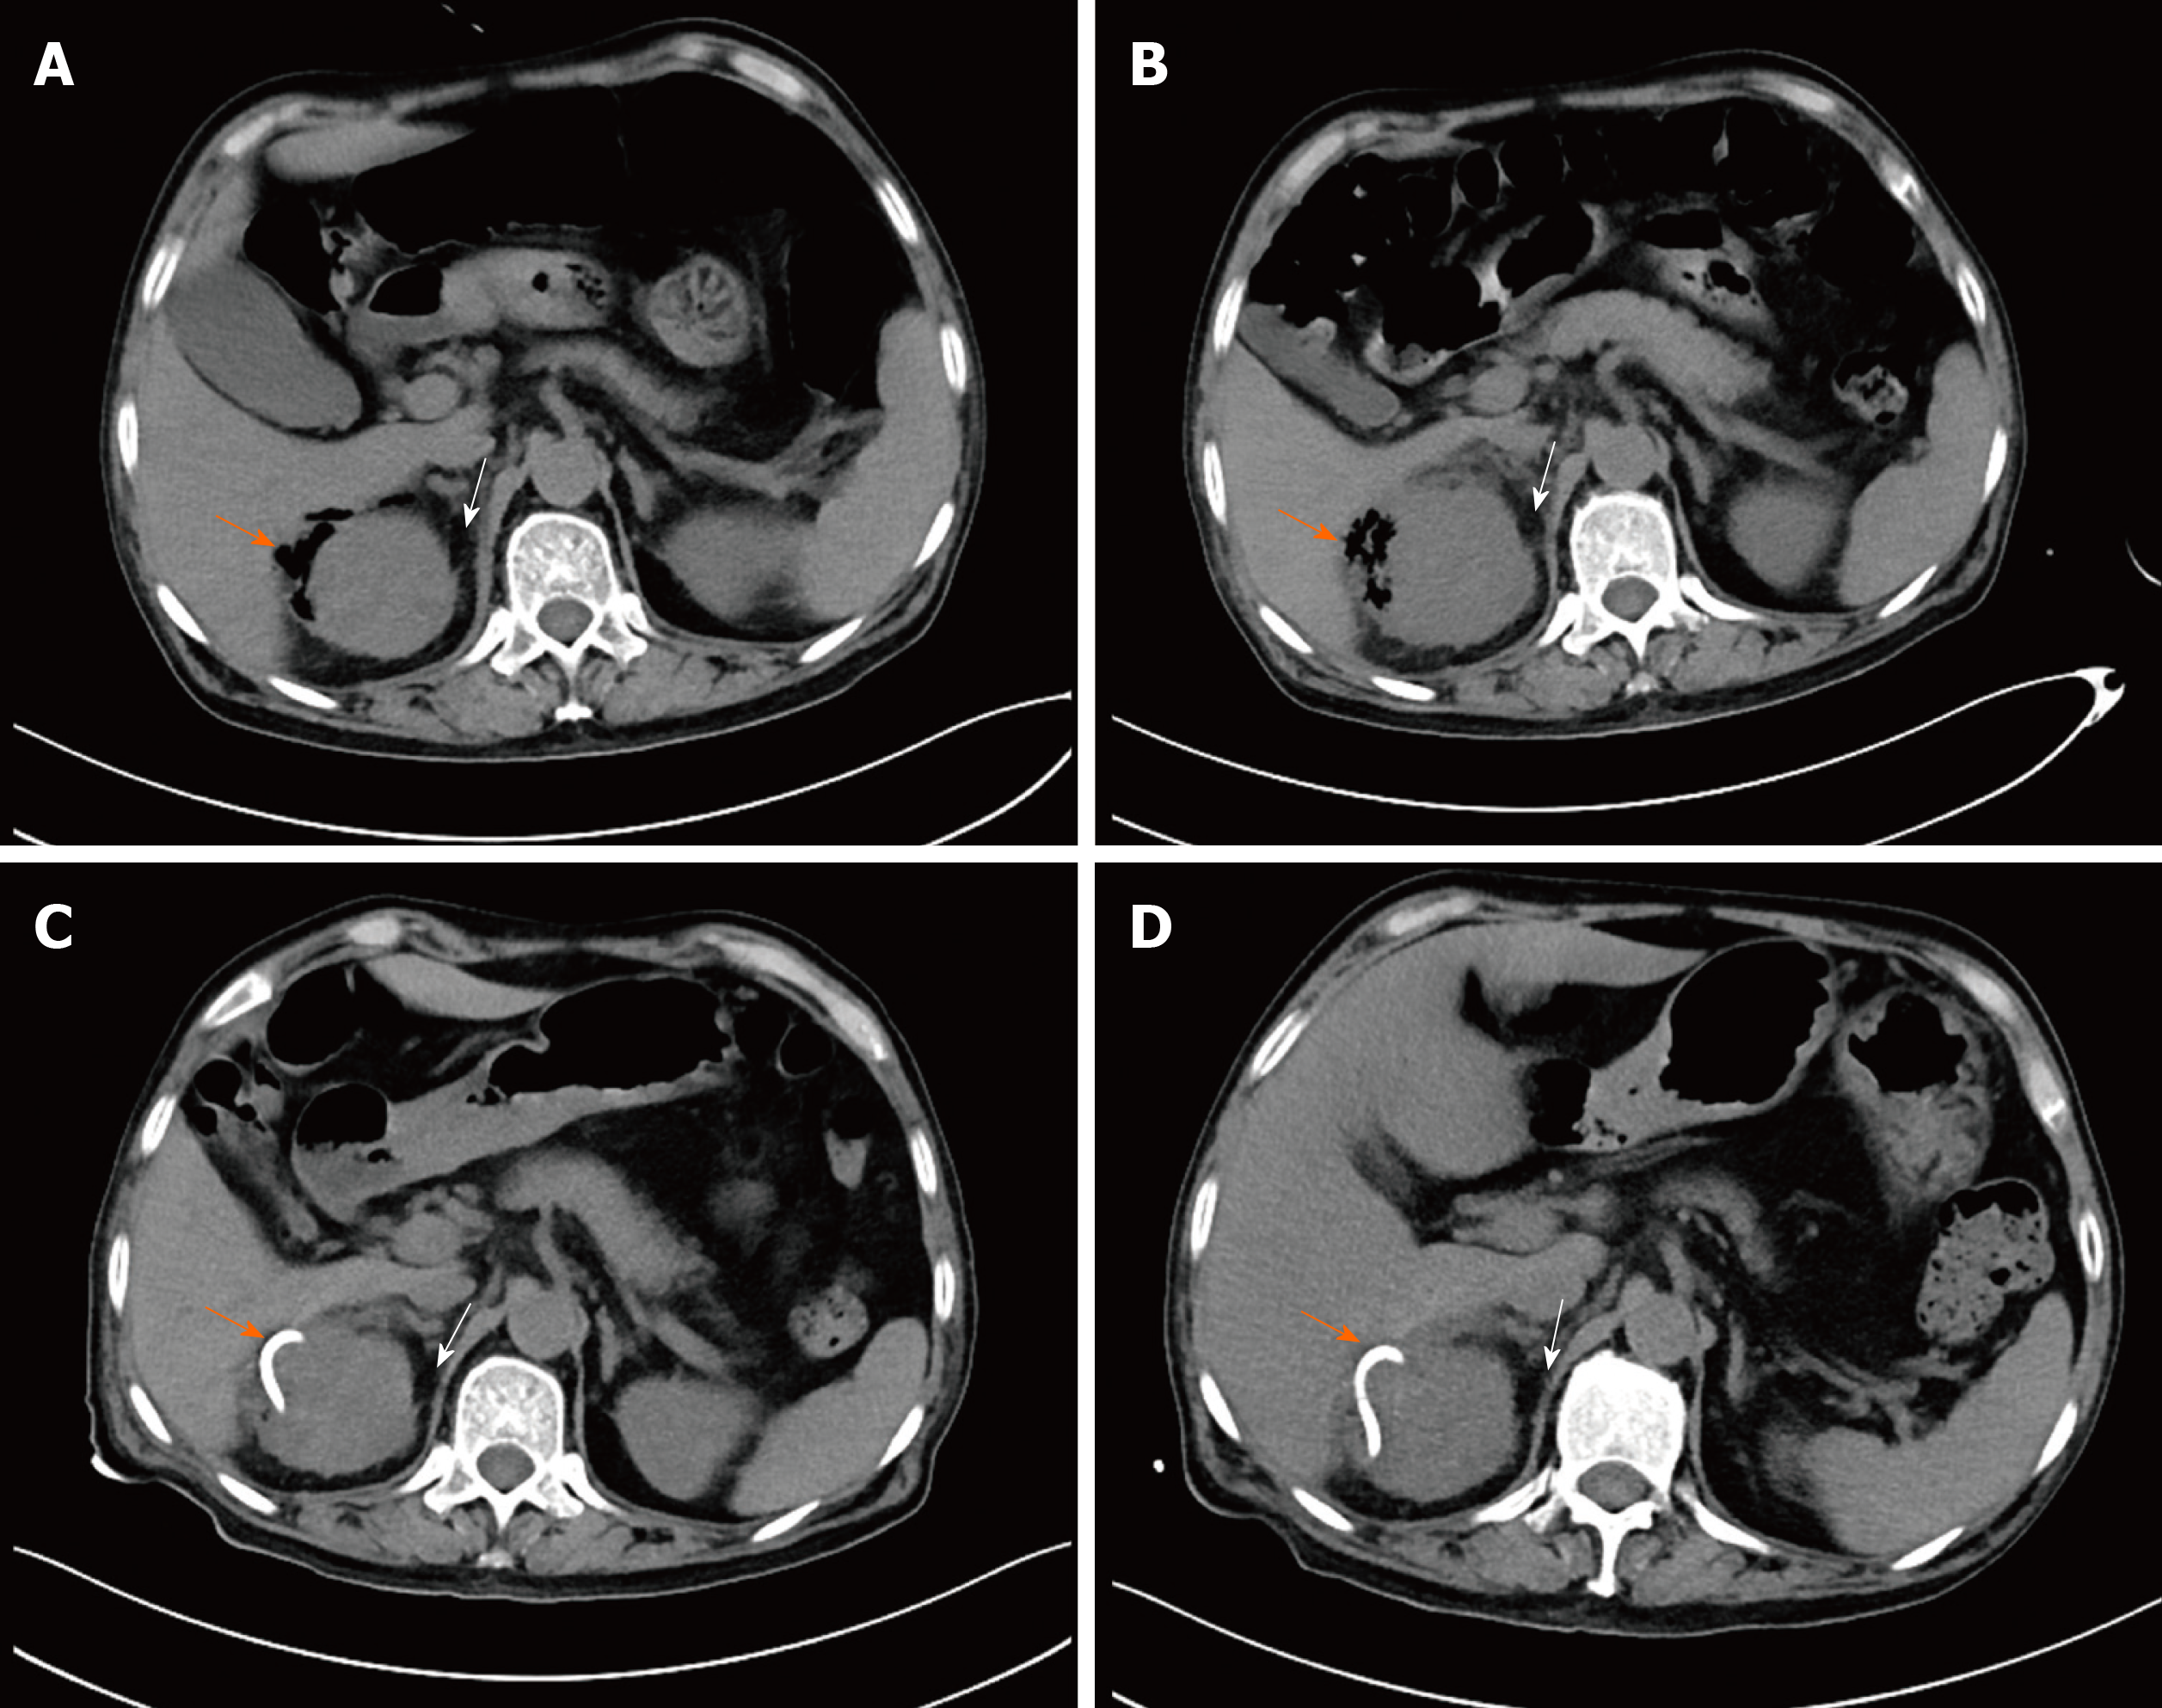
Figure 2 Comparison of computed tomography scans of the right kidney.
A: Image on day 3 after symptom onset showing gas bubbles (orange oblique arrow) in the right perirenal space and an enlarged kidney with perinephric fat stranding (PFS) (white oblique arrow); B: Image on day 7 after symptom onset showing gas bubbles plus an abscess in the right perirenal space (orange oblique arrow) and a more enlarged kidney with more PFS (white oblique arrow); C: Image on day 9 after symptom onset showing a pig-tail catheter (orange oblique arrow) in the right perirenal space and an enlarged kidney with PFS (white oblique arrow); D: Image on day 11 after symptom onset showing a pig-tail catheter (orange oblique arrow) in the right perirenal space and a normal-size kidney with clear perinephric fat (white oblique arrow).
- Citation: Xing ZX, Yang H, Zhang W, Wang Y, Wang CS, Chen T, Chen HJ. Point-of-care ultrasound for the early diagnosis of emphysematous pyelonephritis: A case report and literature review . World J Clin Cases 2021; 9(11): 2584-2594
- URL: https://www.wjgnet.com/2307-8960/full/v9/i11/2584.htm
- DOI: https://dx.doi.org/10.12998/wjcc.v9.i11.2584


