Copyright
©The Author(s) 2020.
World J Clin Cases. Jan 26, 2020; 8(2): 415-424
Published online Jan 26, 2020. doi: 10.12998/wjcc.v8.i2.415
Published online Jan 26, 2020. doi: 10.12998/wjcc.v8.i2.415
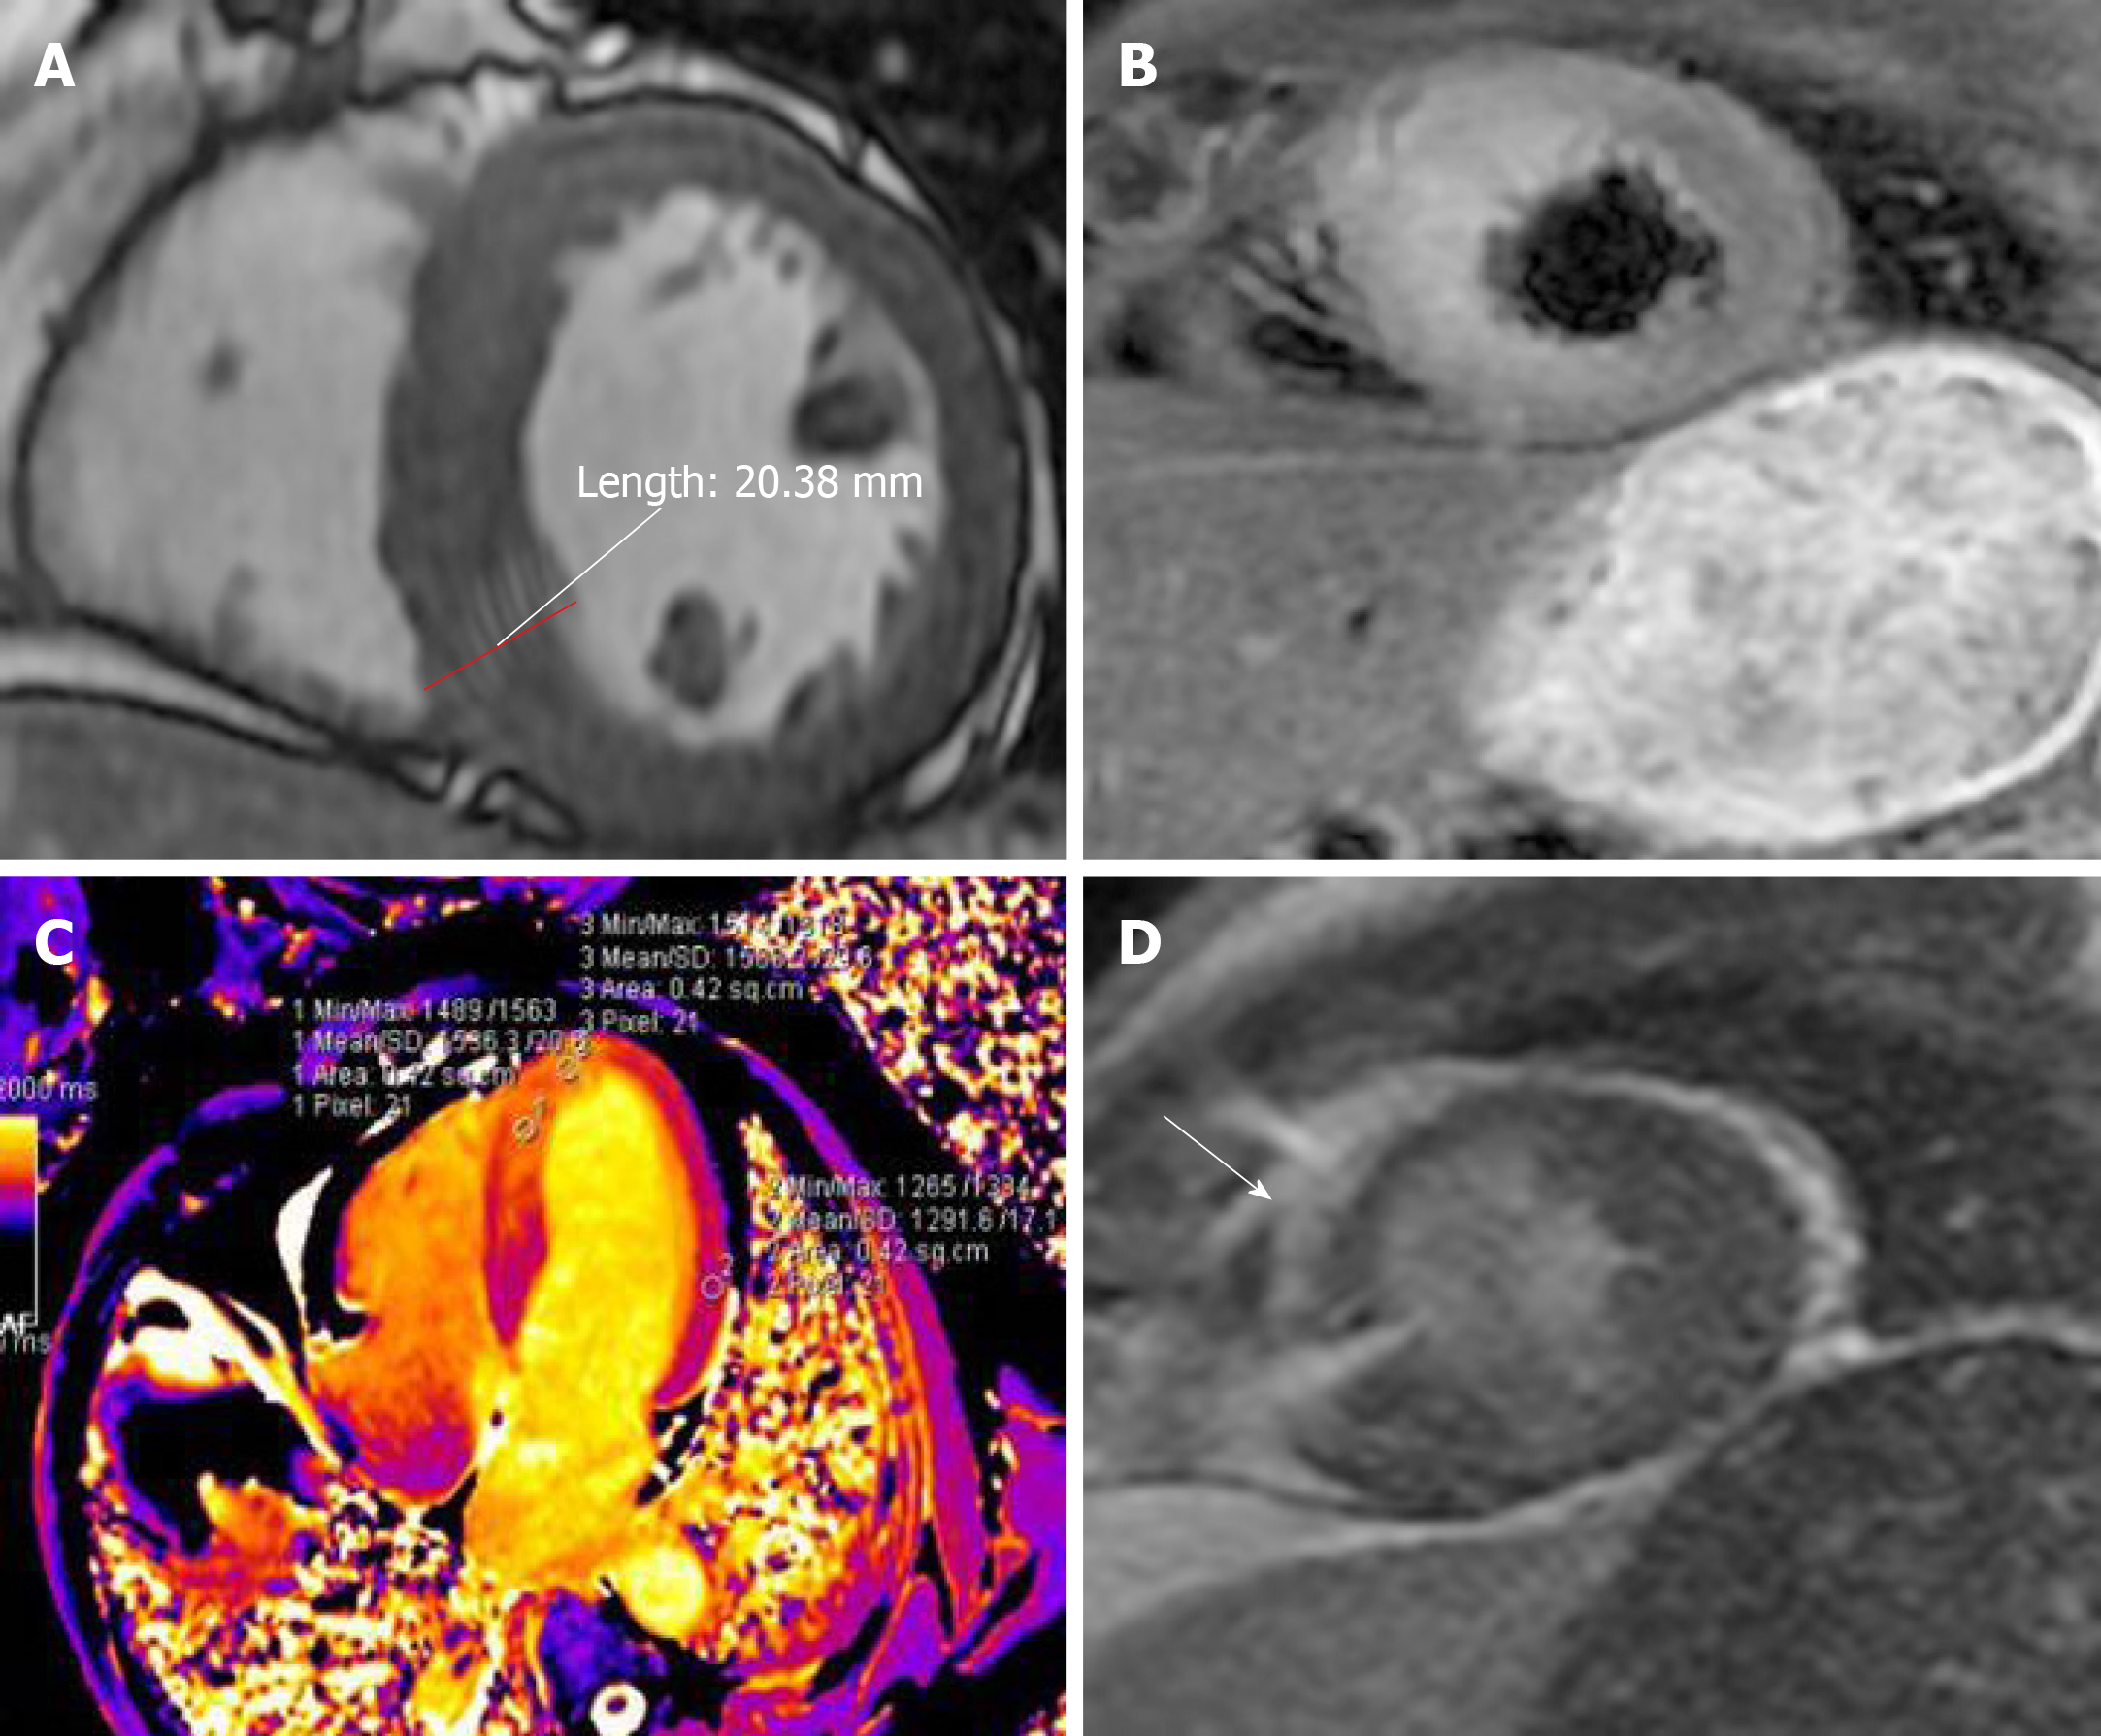
Figure 4 Cardiovascular magnetic resonance imaging.
A: In the CINE sequence at the left ventricular end-diastolic phase, the ventricular wall was 20.38 mm, which was more thicken than the normal (about 12 mm); B: FS-T2WI showed obvious edema; C: The T1 mapping showed that the T1 value of the walls was obviously higher than that of the normal walls (1586.3 ms vs 1291.6 ms) in the interventricular septum in the first cardiovascular magnetic resonance; D: Late gadolinium enhancement of the endocardium and middle myocardium of the middle and apical septal walls.
- Citation: Hou YM, Han PX, Wu X, Lin JR, Zheng F, Lin L, Xu R. Myocarditis presenting as typical acute myocardial infarction: A case report and review of the literature. World J Clin Cases 2020; 8(2): 415-424
- URL: https://www.wjgnet.com/2307-8960/full/v8/i2/415.htm
- DOI: https://dx.doi.org/10.12998/wjcc.v8.i2.415


