Copyright
©The Author(s) 2020.
World J Clin Cases. Oct 6, 2020; 8(19): 4603-4608
Published online Oct 6, 2020. doi: 10.12998/wjcc.v8.i19.4603
Published online Oct 6, 2020. doi: 10.12998/wjcc.v8.i19.4603
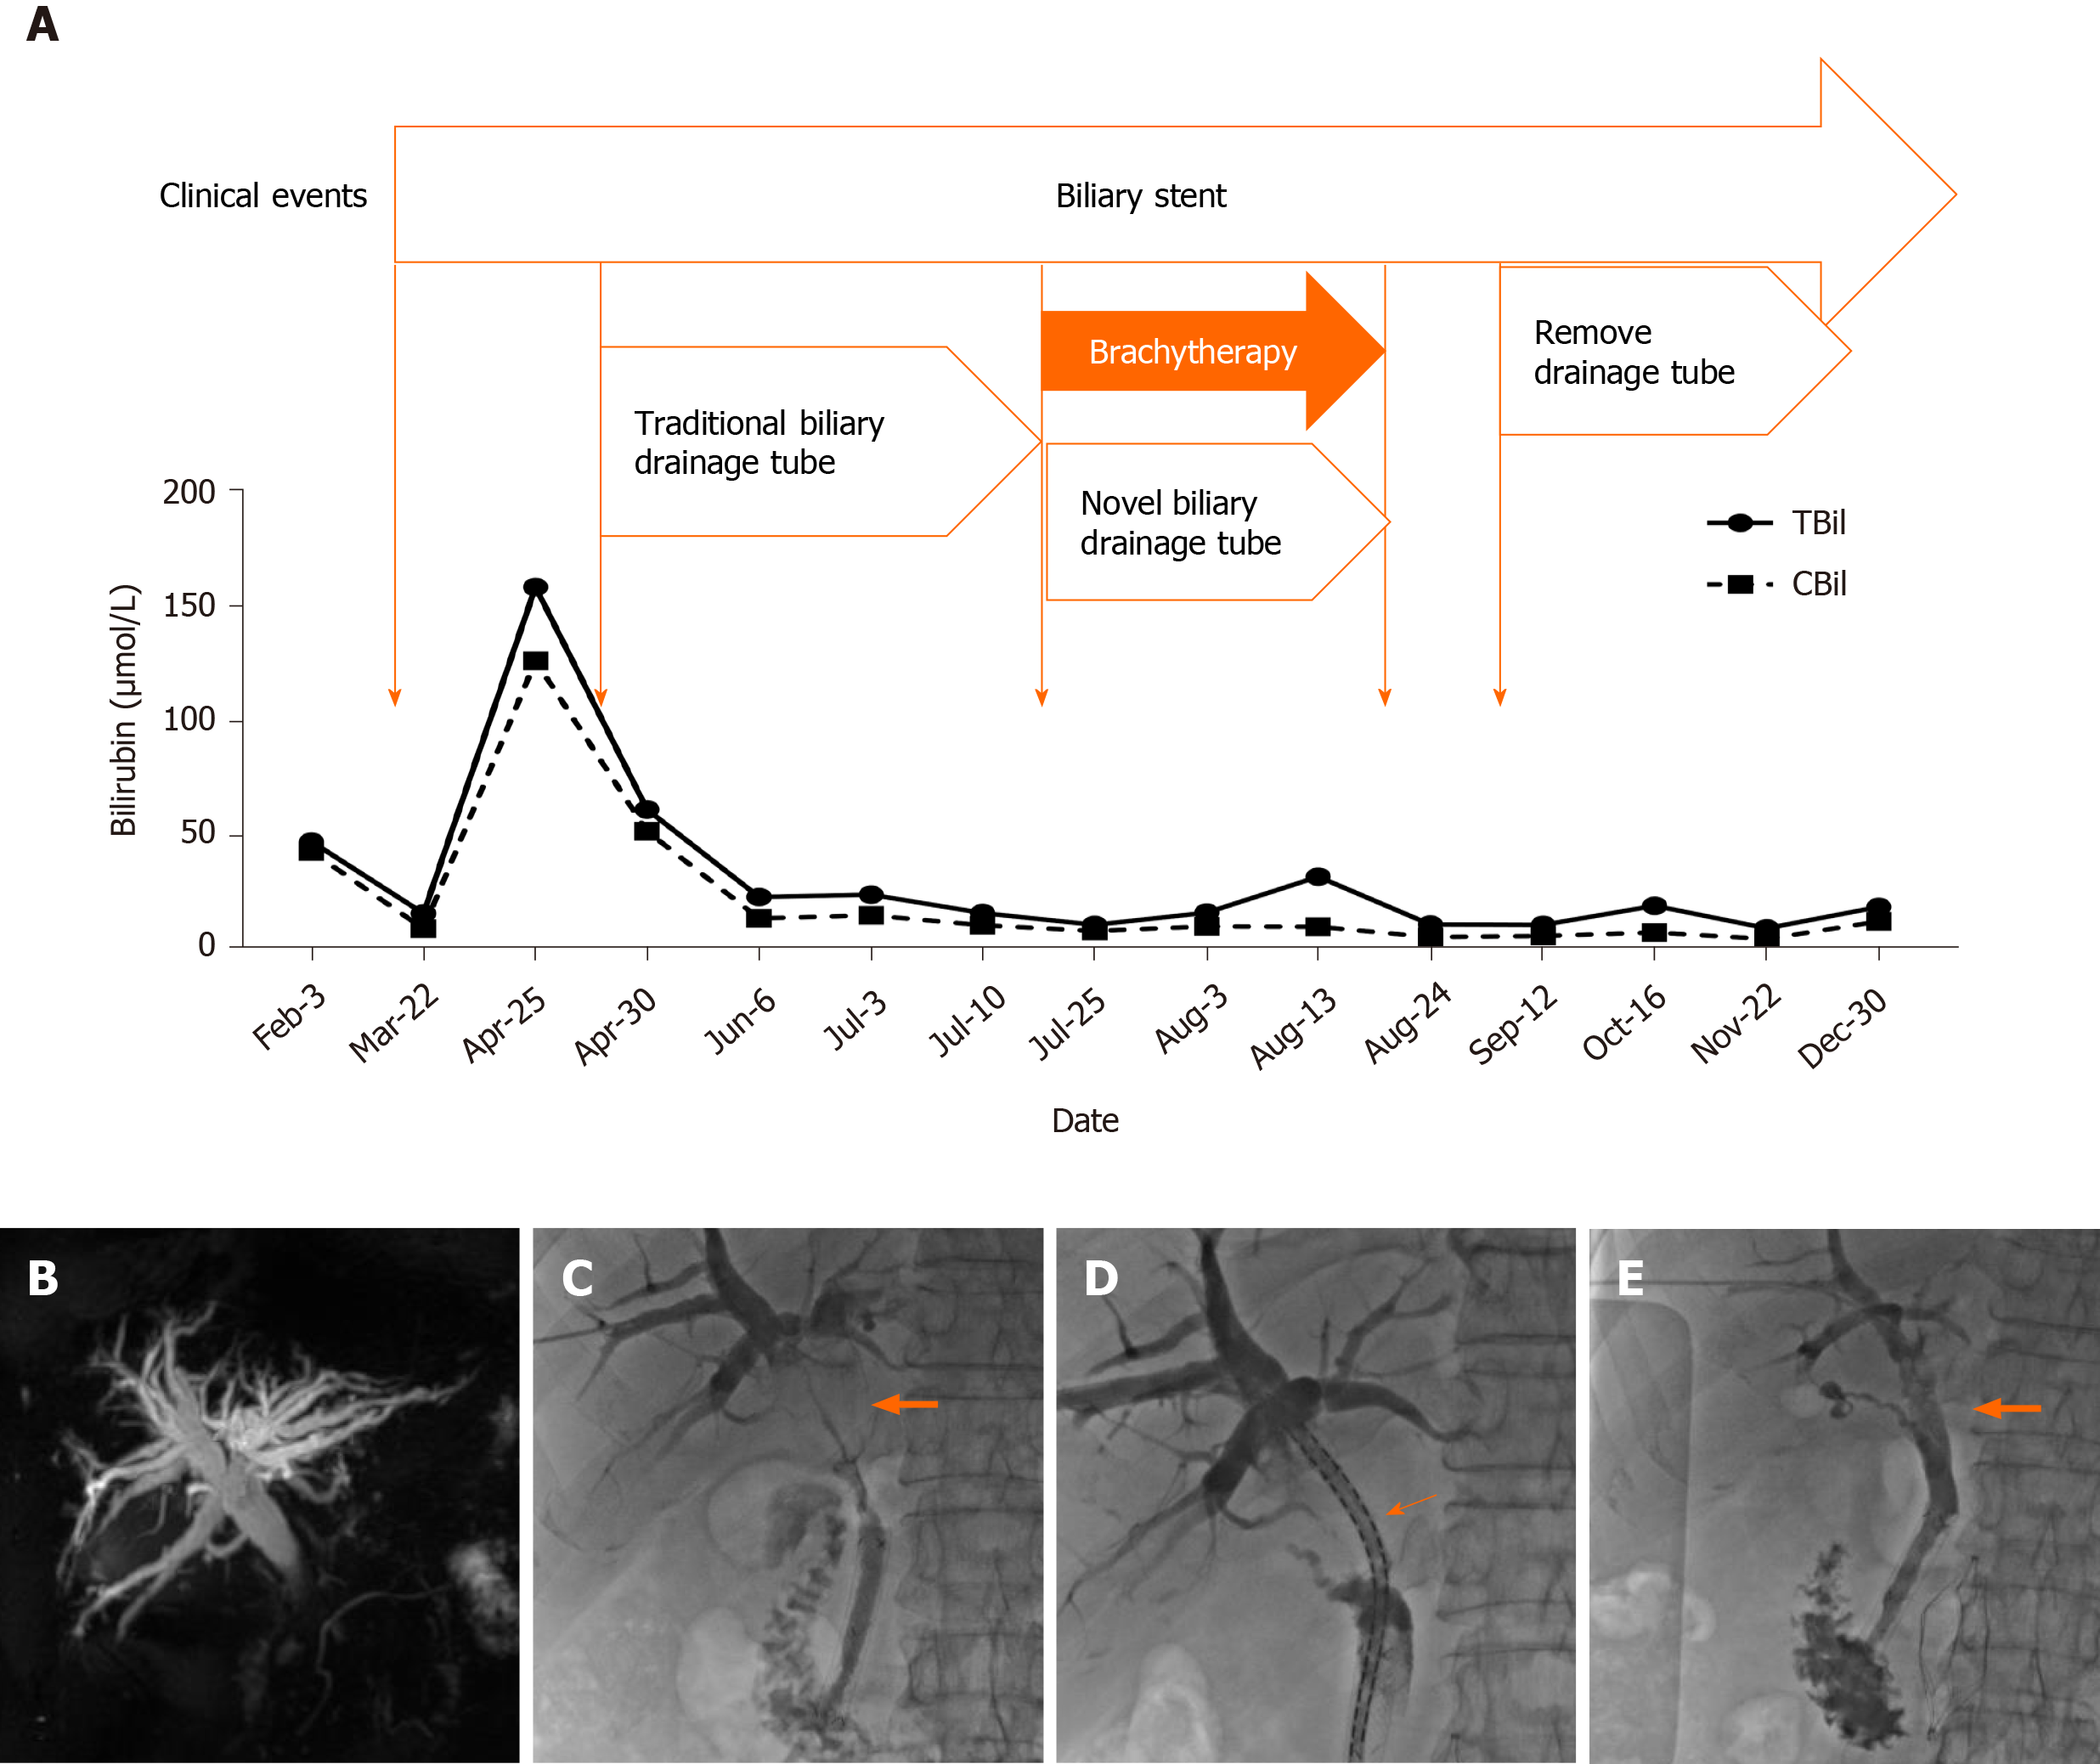
Figure 1 Schematic diagram of the patient's treatment process.
A: Changes in bilirubin levels during the treatment and follow-up of this patient; B: Preoperative magnetic resonance cholangiopancreatography indicated obstructive lesions in the bile duct; C-E: After brachytherapy, the obstruction of hilar cholangiocarcinoma disappeared. The thick arrows show the lesion site before and after treatment; the thin arrow indicates 125I seeds arranged in the drainage tube.
- Citation: Lei QY, Jiao DC, Han XW. Novel brachytherapy drainage tube loaded with double 125I strands for hilar cholangiocarcinoma: A case report. World J Clin Cases 2020; 8(19): 4603-4608
- URL: https://www.wjgnet.com/2307-8960/full/v8/i19/4603.htm
- DOI: https://dx.doi.org/10.12998/wjcc.v8.i19.4603


