Copyright
©The Author(s) 2020.
World J Clin Cases. Sep 6, 2020; 8(17): 3911-3919
Published online Sep 6, 2020. doi: 10.12998/wjcc.v8.i17.3911
Published online Sep 6, 2020. doi: 10.12998/wjcc.v8.i17.3911
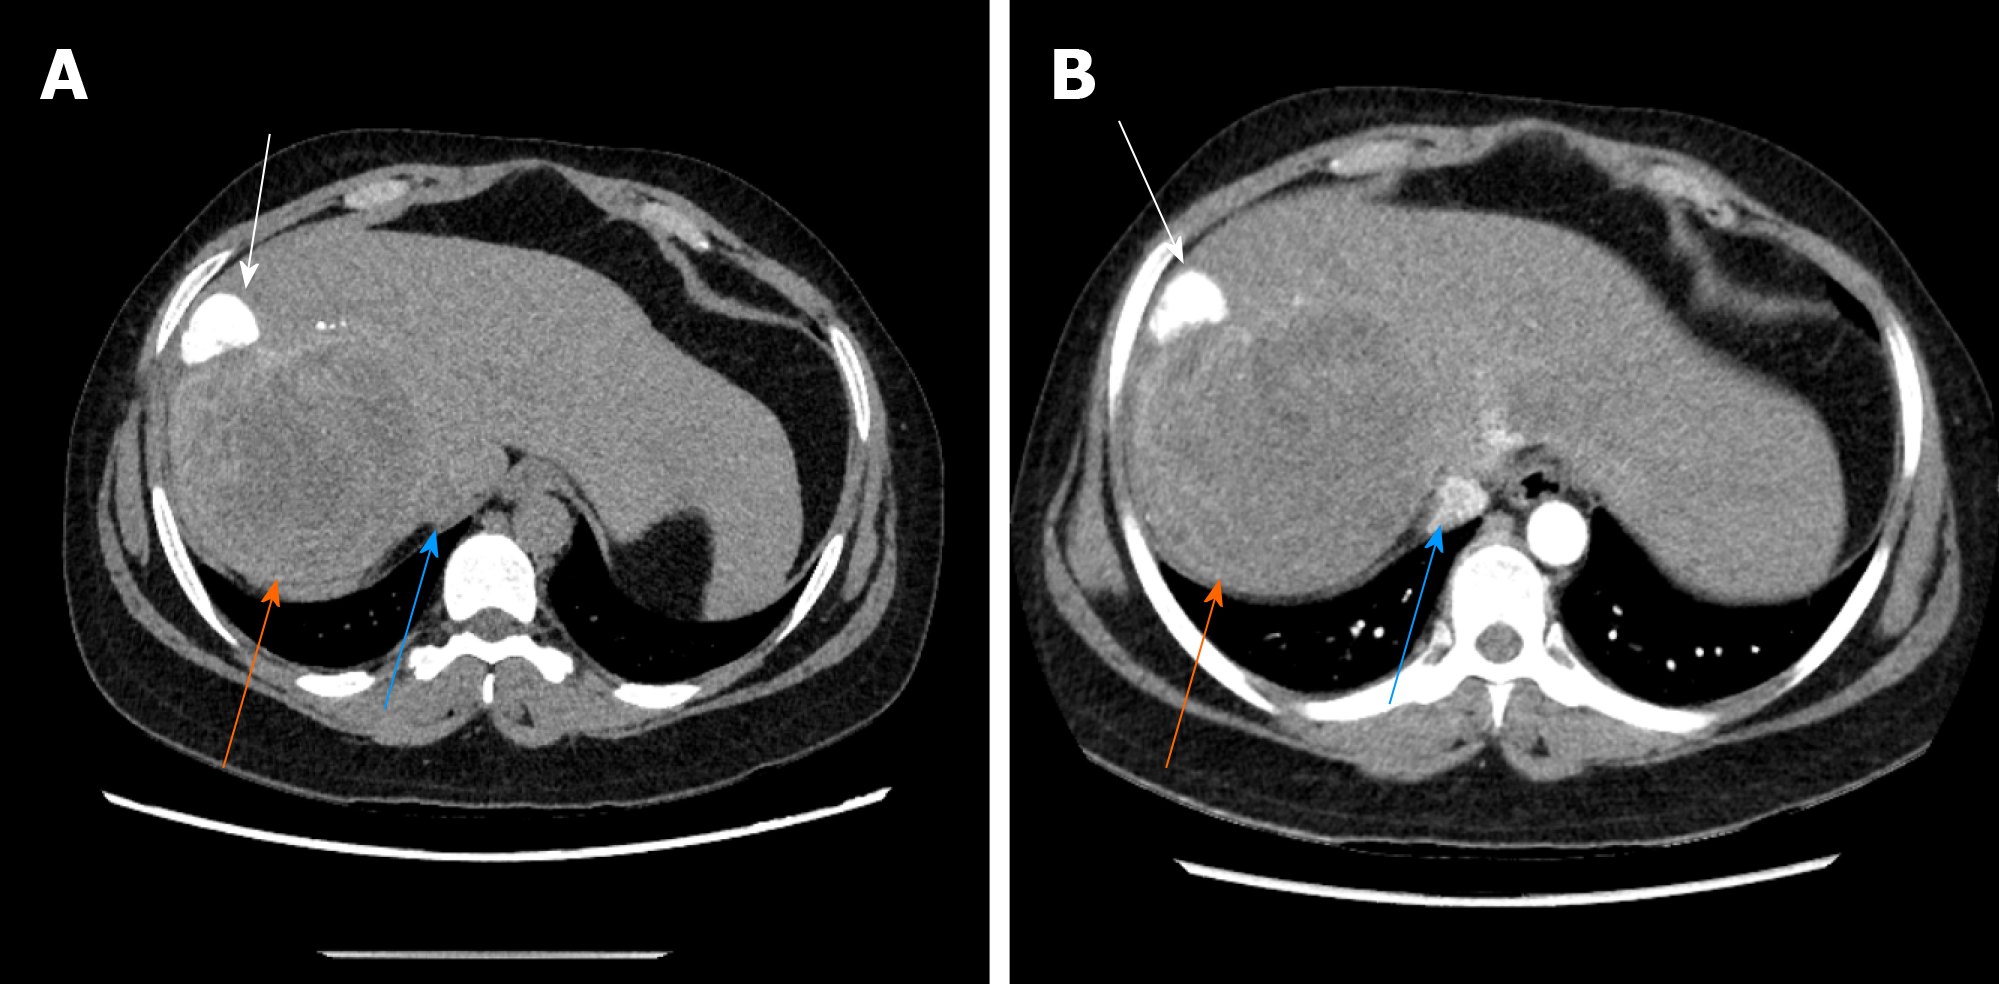
Figure 5 The fourth case of abdominal enhancement computed tomography.
A, B: The white arrow shows cystic hydatid foci in high density, the orange arrow shows alveolar hydatid foci in low density, and the blue arrow shows posterior inferior vena cava in equal density.
- Citation: A JD, Chai JP, Wang H, Gao W, Peng Z, Zhao SY, A XR. Diagnosis and treatment of mixed infection of hepatic cystic and alveolar echinococcosis: Four case reports. World J Clin Cases 2020; 8(17): 3911-3919
- URL: https://www.wjgnet.com/2307-8960/full/v8/i17/3911.htm
- DOI: https://dx.doi.org/10.12998/wjcc.v8.i17.3911


