Copyright
©The Author(s) 2020.
World J Clin Cases. Jun 26, 2020; 8(12): 2590-2596
Published online Jun 26, 2020. doi: 10.12998/wjcc.v8.i12.2590
Published online Jun 26, 2020. doi: 10.12998/wjcc.v8.i12.2590
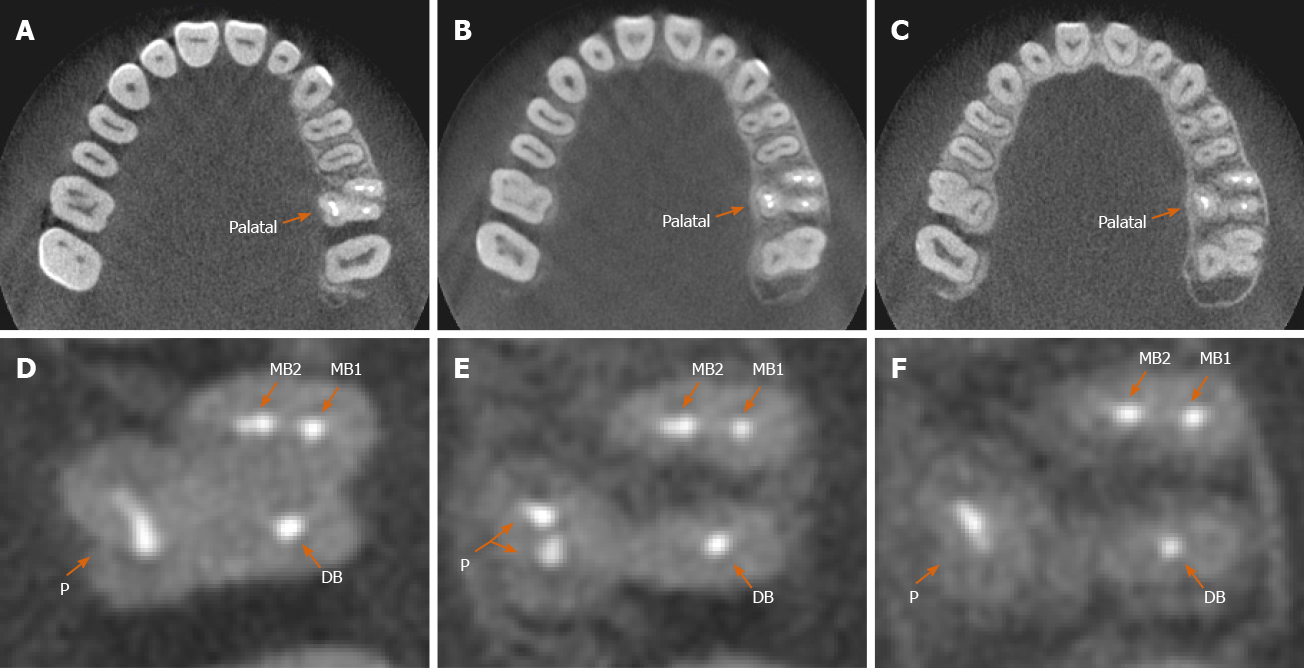
Figure 3 Analysis of anatomical structure by cone beam computed tomography after the treatment.
A-C: Cone beam computed tomography images showing axial sections at the cervical (A), middle (B), and apical levels (C) 1 year after root canal therapy; D-F: Enlarged axial section cone beam computed tomography images at the cervical (D), middle (E), and apical levels (F) of the left maxillary first molar (orange arrows). MB: Mesiobuccal; DB: Distobuccal.
- Citation: Zhang ZH, Yao HL, Zhang Y, Wang X. Endodontic management of the maxillary first molar with special root canals: A case report and review of the literature. World J Clin Cases 2020; 8(12): 2590-2596
- URL: https://www.wjgnet.com/2307-8960/full/v8/i12/2590.htm
- DOI: https://dx.doi.org/10.12998/wjcc.v8.i12.2590


