Copyright
©The Author(s) 2020.
World J Clin Cases. Jun 6, 2020; 8(11): 2399-2405
Published online Jun 6, 2020. doi: 10.12998/wjcc.v8.i11.2399
Published online Jun 6, 2020. doi: 10.12998/wjcc.v8.i11.2399
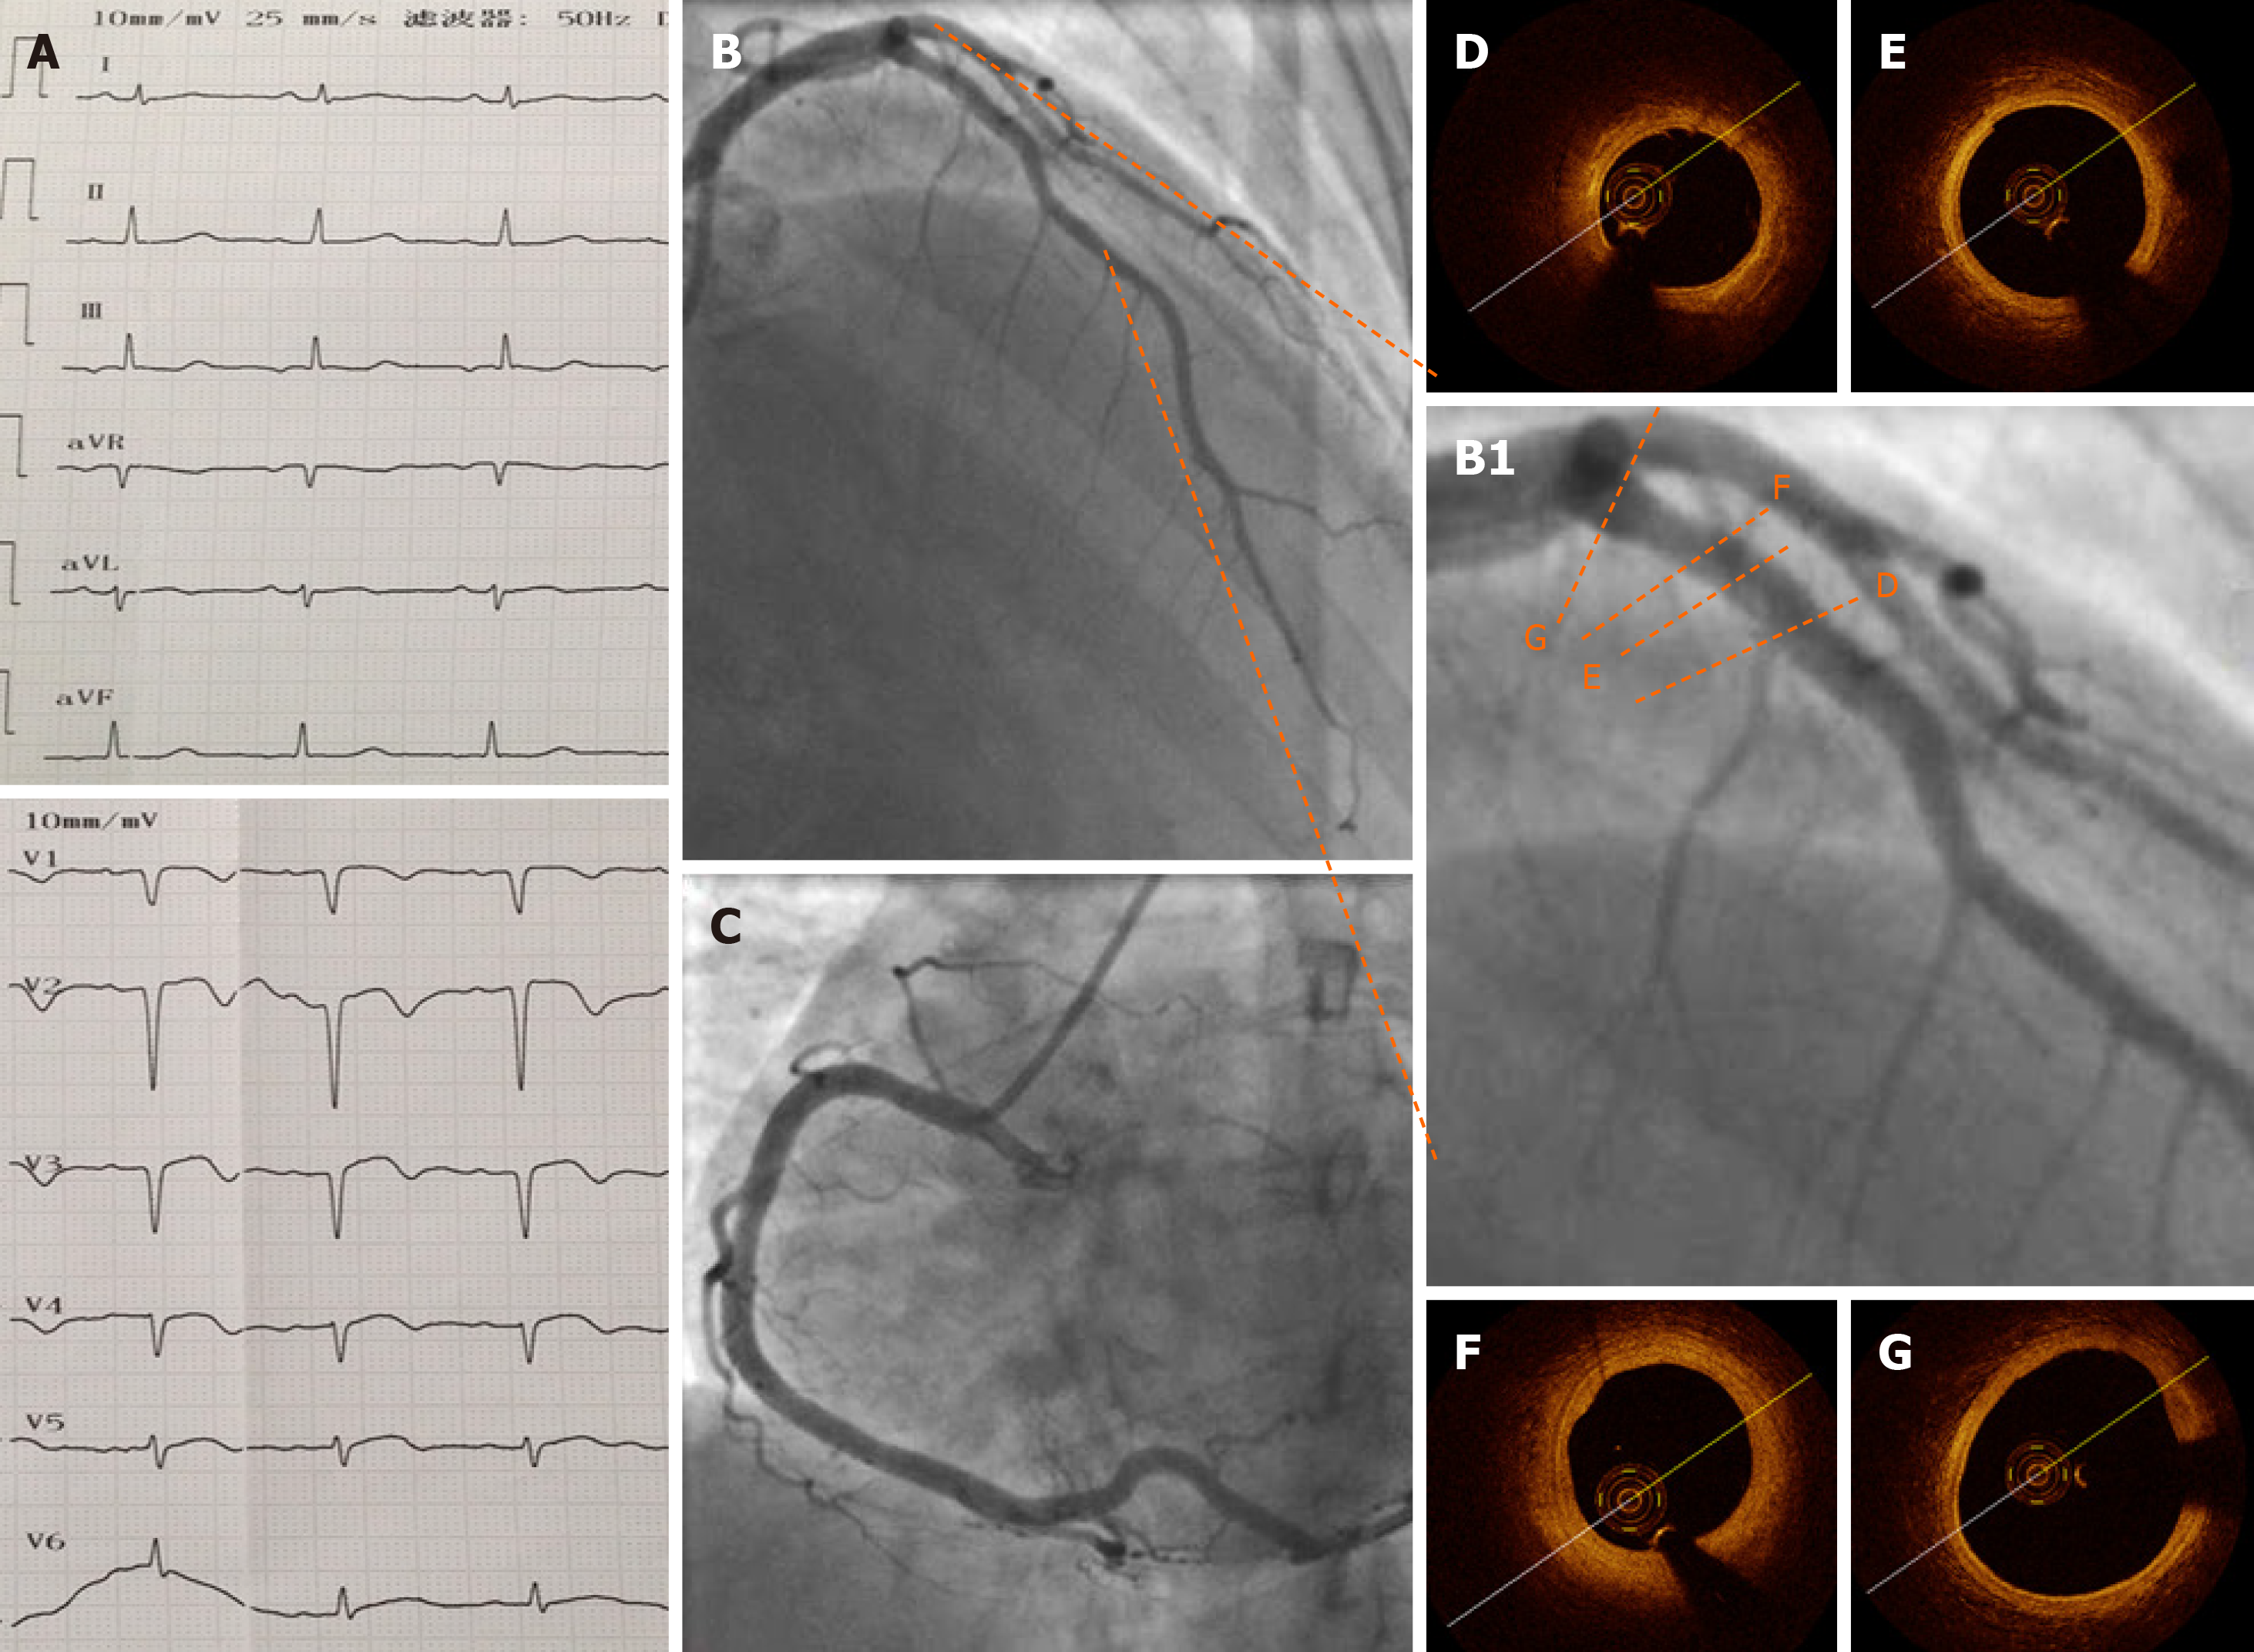
Figure 3 Electrocardiography, coronary angiography, and optical coherence tomography at 1 wk after the procedure.
A: Pathological Q waves were visible on electrocardiography in leads V1–V4 at 1 wk after the procedure; B and C: One week later, coronary angiography showed a normal proximal left anterior descending artery (pLAD) and normal repeated thrombus aspirations; B1: Zoomed-in image of pLAD; D-G: Representative images of the pLAD showing a nearly normal coronary artery with an intact intima and no residual thrombus. F: Focal segment of a stable thick-cap plaque. Minimal lumen area was 5.57 mm2, and the percentage of area stenosis was 16.6%.
- Citation: Du BB, Wang XT, Tong YL, Liu K, Li PP, Li XD, Yang P, Wang Y. Optical coherence tomography guided treatment avoids stenting in an antiphospholipid syndrome patient: A case report. World J Clin Cases 2020; 8(11): 2399-2405
- URL: https://www.wjgnet.com/2307-8960/full/v8/i11/2399.htm
- DOI: https://dx.doi.org/10.12998/wjcc.v8.i11.2399


