Copyright
©The Author(s) 2019.
World J Clin Cases. Oct 26, 2019; 7(20): 3226-3236
Published online Oct 26, 2019. doi: 10.12998/wjcc.v7.i20.3226
Published online Oct 26, 2019. doi: 10.12998/wjcc.v7.i20.3226
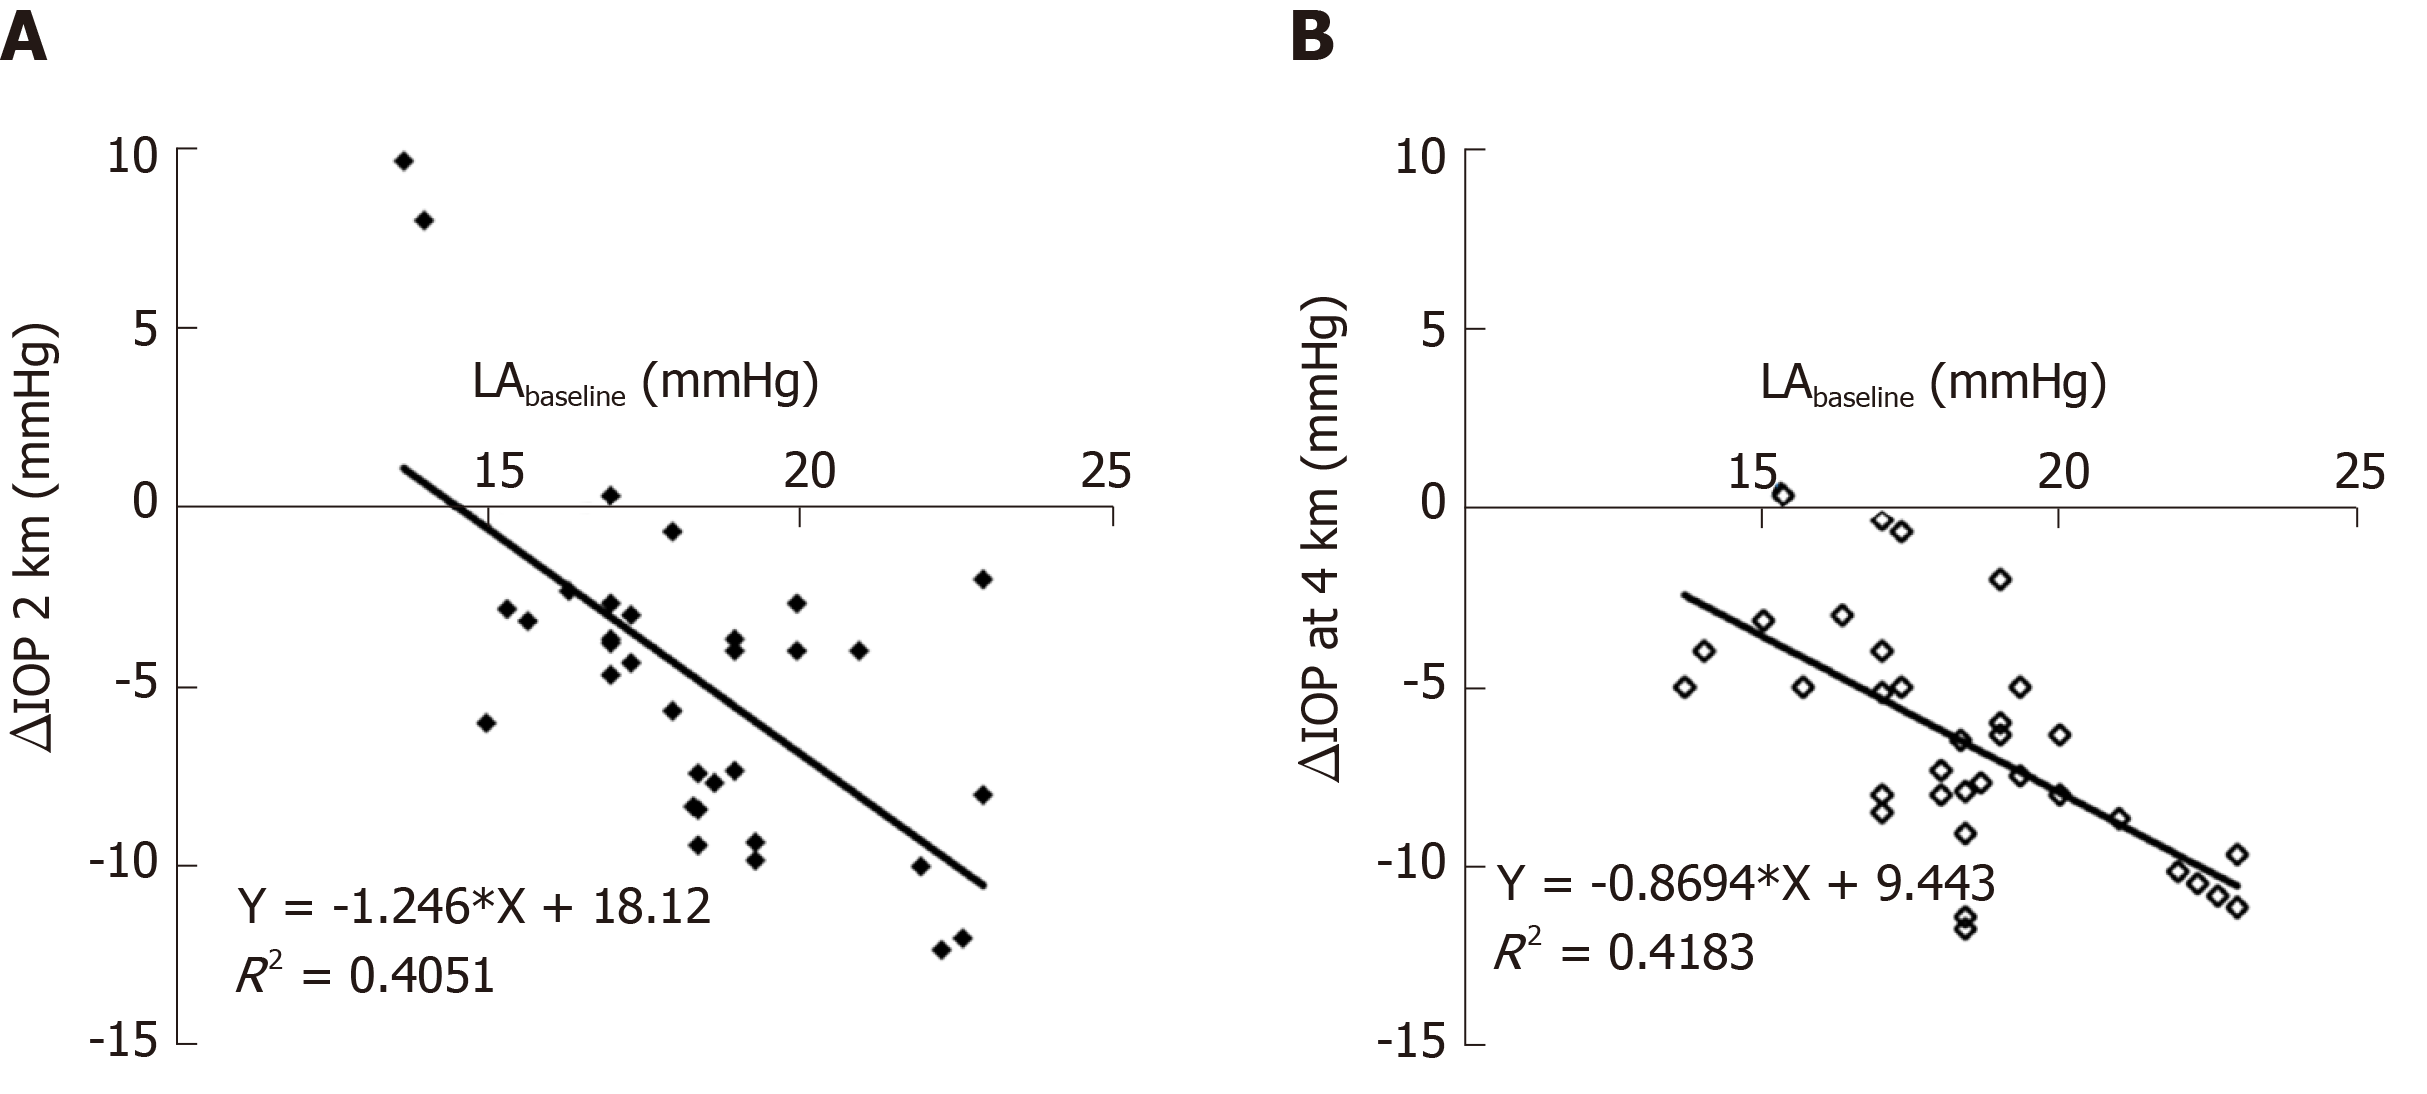
Figure 3 Scatter plot showed the correlation between intraocular pressure before ascent (Low altitude baseline) as well as intraocular pressure changes at 2261 m and 3750 m above sea level in the low altitude group.
Higher baseline intraocular pressure (IOP) correlated with greater IOP changes at 2261 m (A) and 3750 m above sea level (B) in the low altitude group. IOP: Intraocular pressure; LA: Low altitude; HA: High altitude; VHA: Very high altitude.
- Citation: Xie Y, Sun YX, Han Y, Yang DY, Yang YQ, Cao K, Li SN, Li X, Lu XX, Wu SZ, Wang NL. Longitudinal observation of intraocular pressure variations with acute altitude changes. World J Clin Cases 2019; 7(20): 3226-3236
- URL: https://www.wjgnet.com/2307-8960/full/v7/i20/3226.htm
- DOI: https://dx.doi.org/10.12998/wjcc.v7.i20.3226


