Copyright
©The Author(s) 2019.
World J Clin Cases. Sep 6, 2019; 7(17): 2519-2525
Published online Sep 6, 2019. doi: 10.12998/wjcc.v7.i17.2519
Published online Sep 6, 2019. doi: 10.12998/wjcc.v7.i17.2519
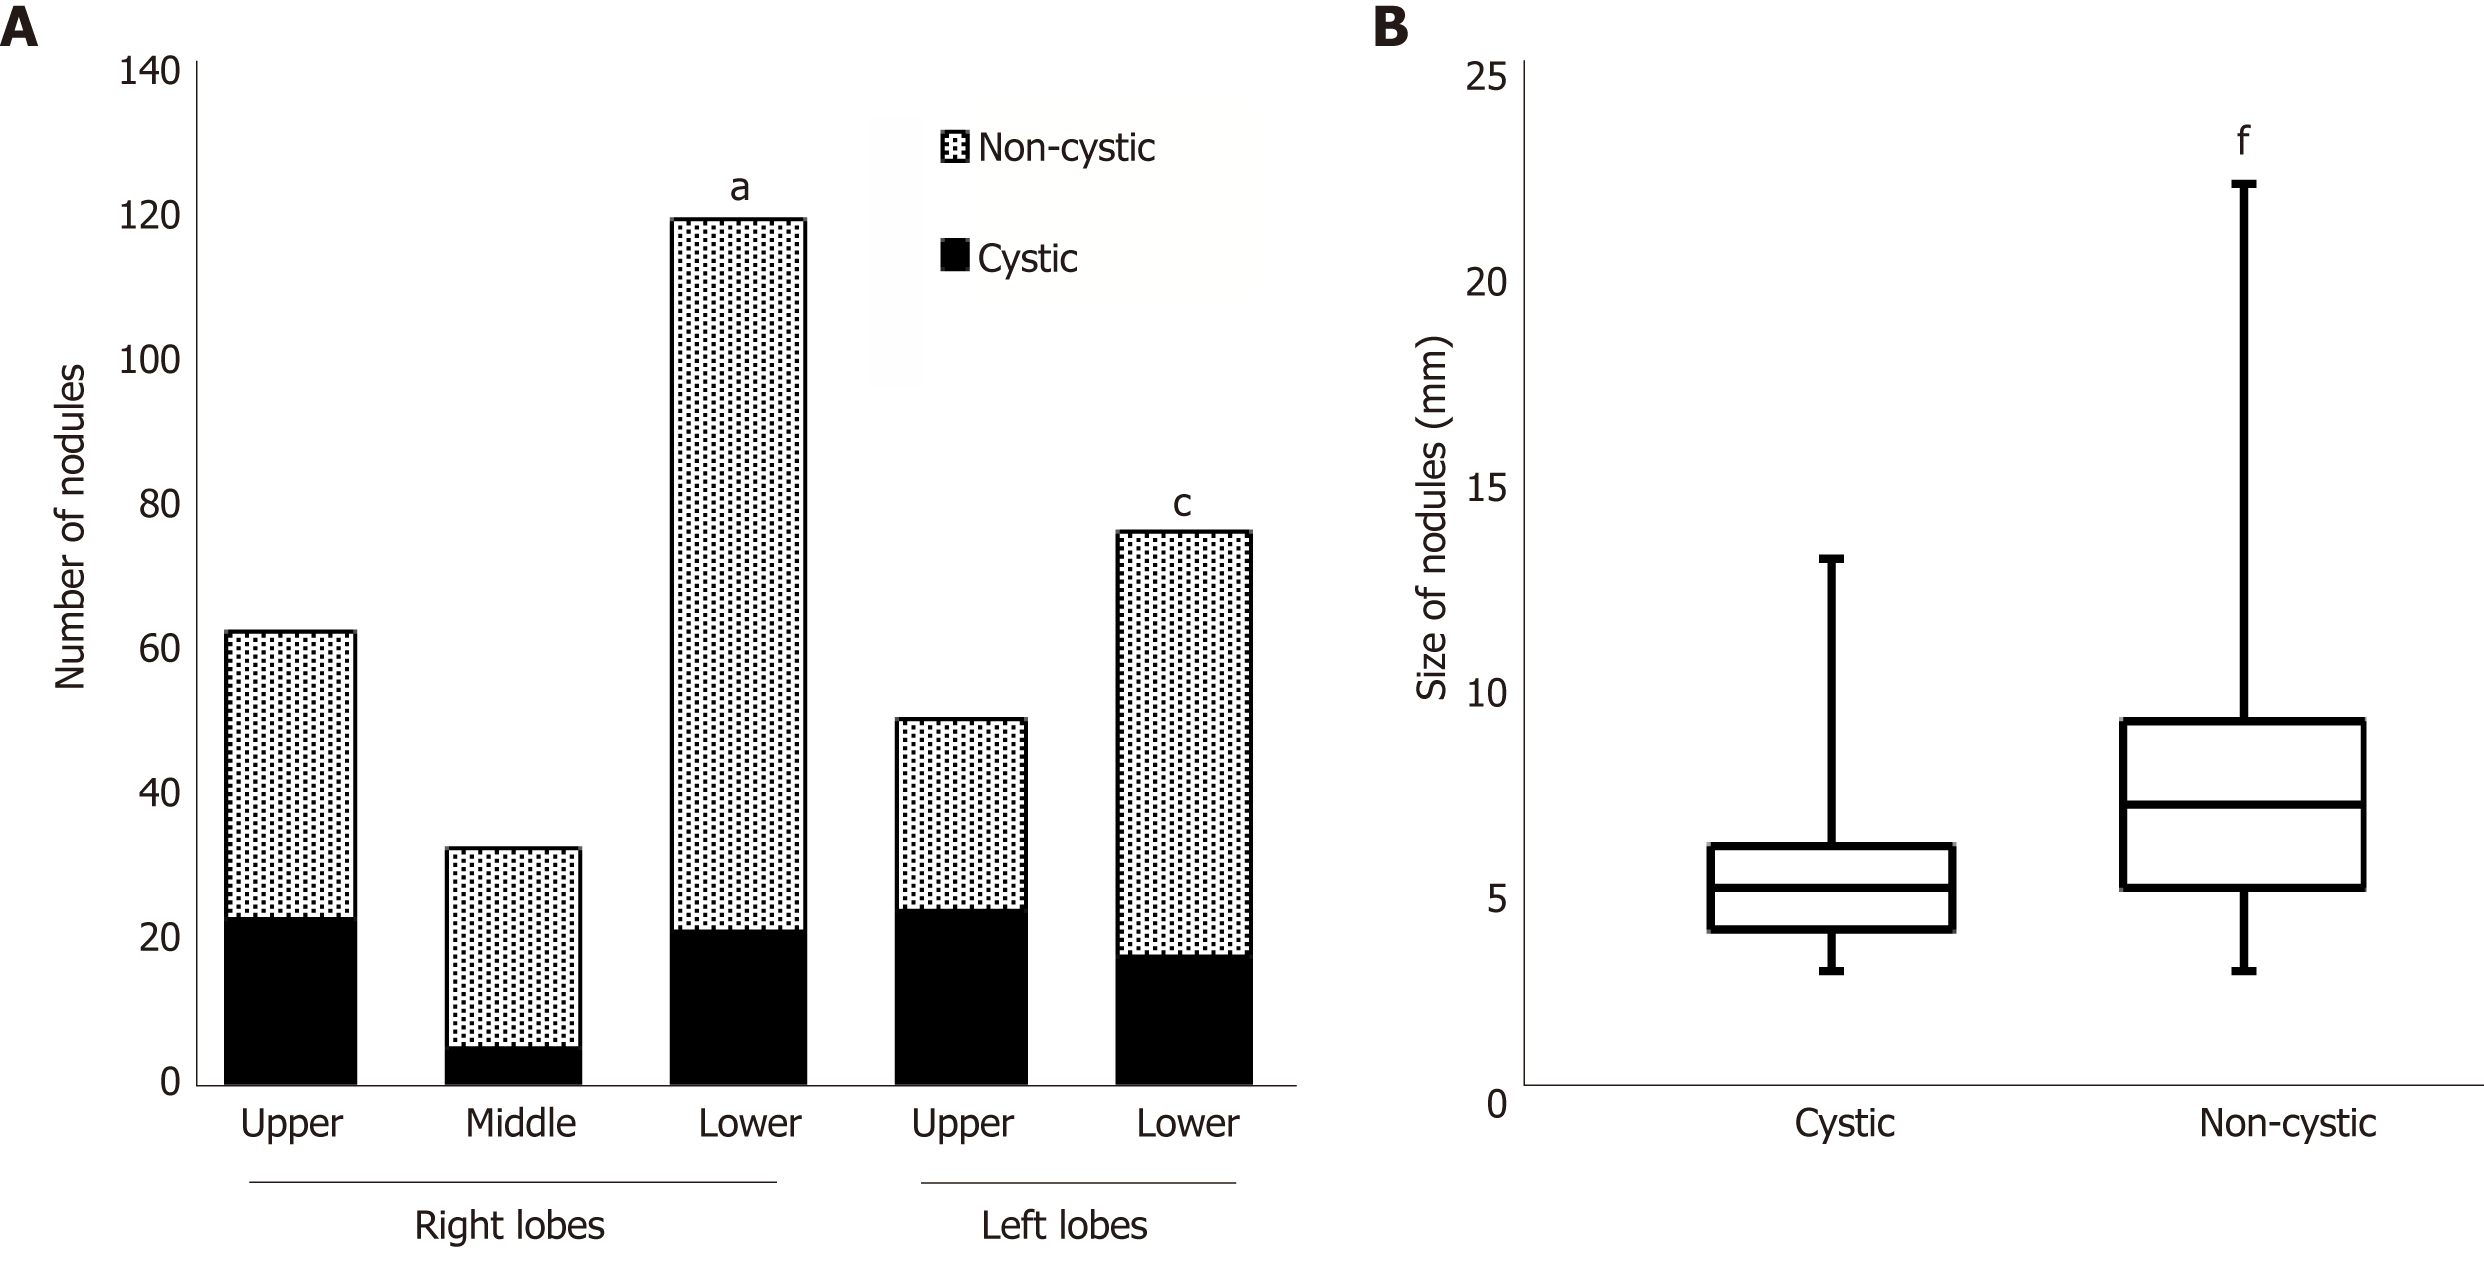
Figure 4 Numbers and sizes of cystic and non-cystic nodules.
A: Number of nodules in each lobe. The prevalence of cystic nodules is compared. aP<0.01 vs the right upper lobe, cP < 0.01 vs the left upper lobe; B: Sizes of the nodules. The data summarize the results of all lung lobes. fP < 0.0001 vs the cystic nodules.
- Citation: Kanaji N, Tokunaga Y, Ishikawa R, Watanabe N, Kadowaki N. Characteristics of multiple nodules in a patient with pulmonary Langerhans cell histiocytosis: A case report. World J Clin Cases 2019; 7(17): 2519-2525
- URL: https://www.wjgnet.com/2307-8960/full/v7/i17/2519.htm
- DOI: https://dx.doi.org/10.12998/wjcc.v7.i17.2519


