Copyright
©The Author(s) 2022.
World J Clin Cases. Jun 16, 2022; 10(17): 5655-5666
Published online Jun 16, 2022. doi: 10.12998/wjcc.v10.i17.5655
Published online Jun 16, 2022. doi: 10.12998/wjcc.v10.i17.5655
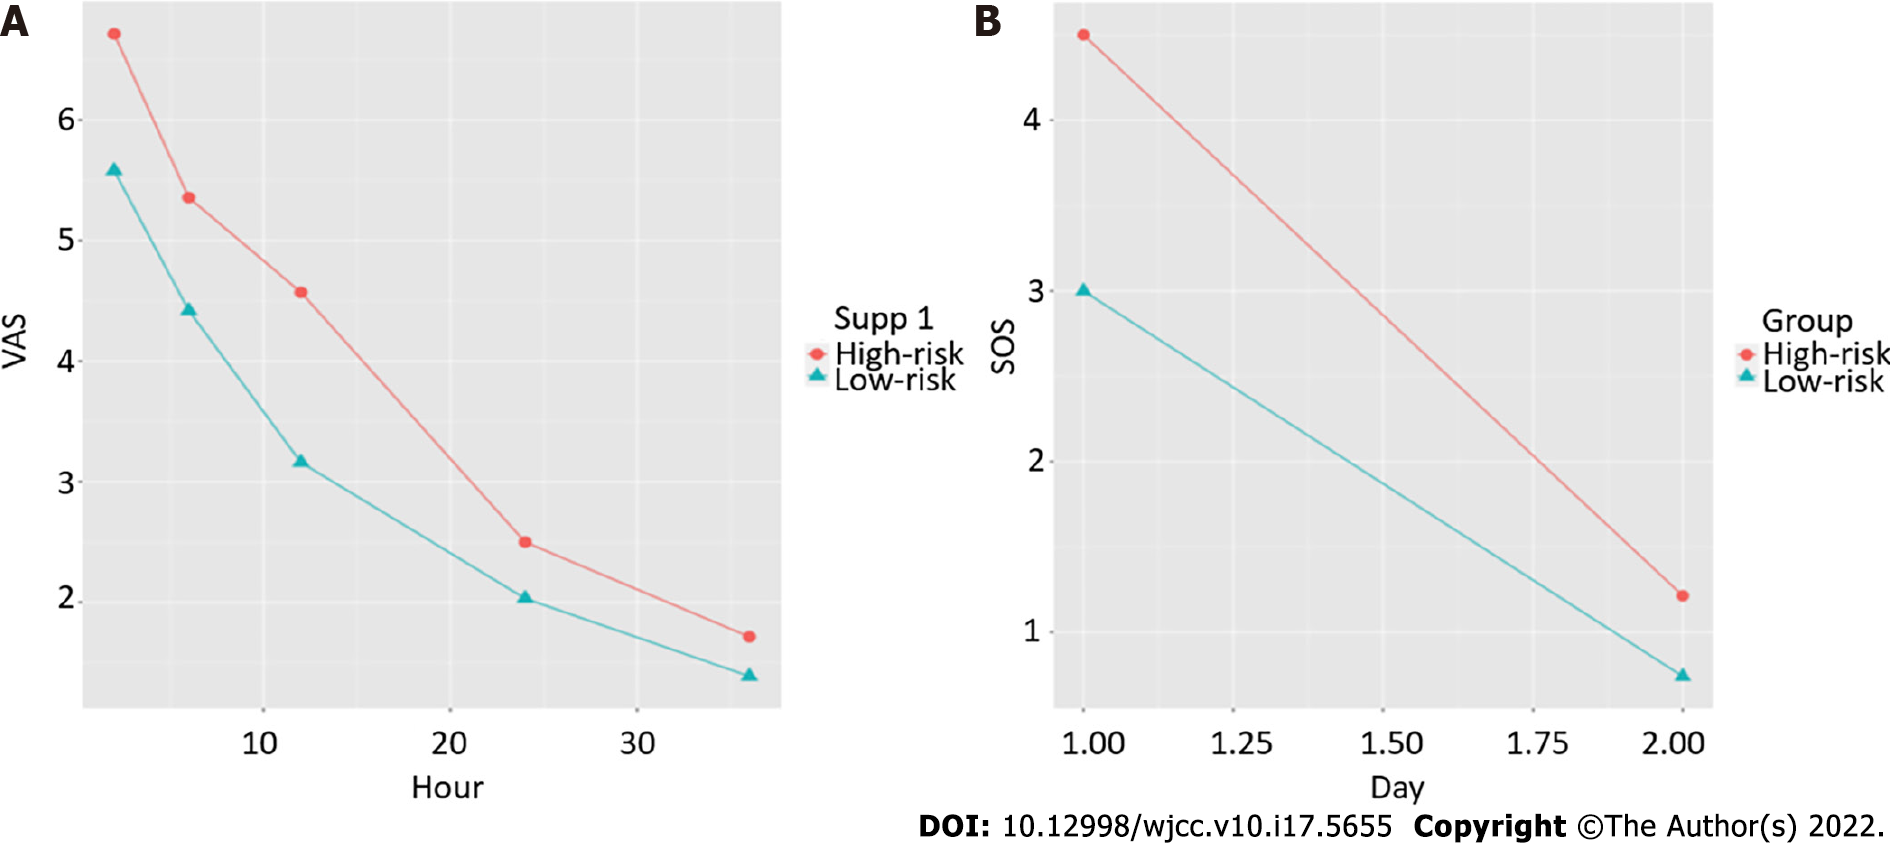
Figure 6 Line charts of the means of the high- and low-risk groups, divided from the raw data, by the nomogram over time.
A: Line chart of the visual analog scale; B: Line chart of the sleep score. VAS: Visual analog scale.
- Citation: Chen WN, Xu YL, Zhang XG. High Eckardt score and previous treatment were associated with poor postperoral endoscopic myotomy pain control: A retrospective study. World J Clin Cases 2022; 10(17): 5655-5666
- URL: https://www.wjgnet.com/2307-8960/full/v10/i17/5655.htm
- DOI: https://dx.doi.org/10.12998/wjcc.v10.i17.5655


