Copyright
©The Author(s) 2022.
World J Clin Cases. Jun 16, 2022; 10(17): 5655-5666
Published online Jun 16, 2022. doi: 10.12998/wjcc.v10.i17.5655
Published online Jun 16, 2022. doi: 10.12998/wjcc.v10.i17.5655
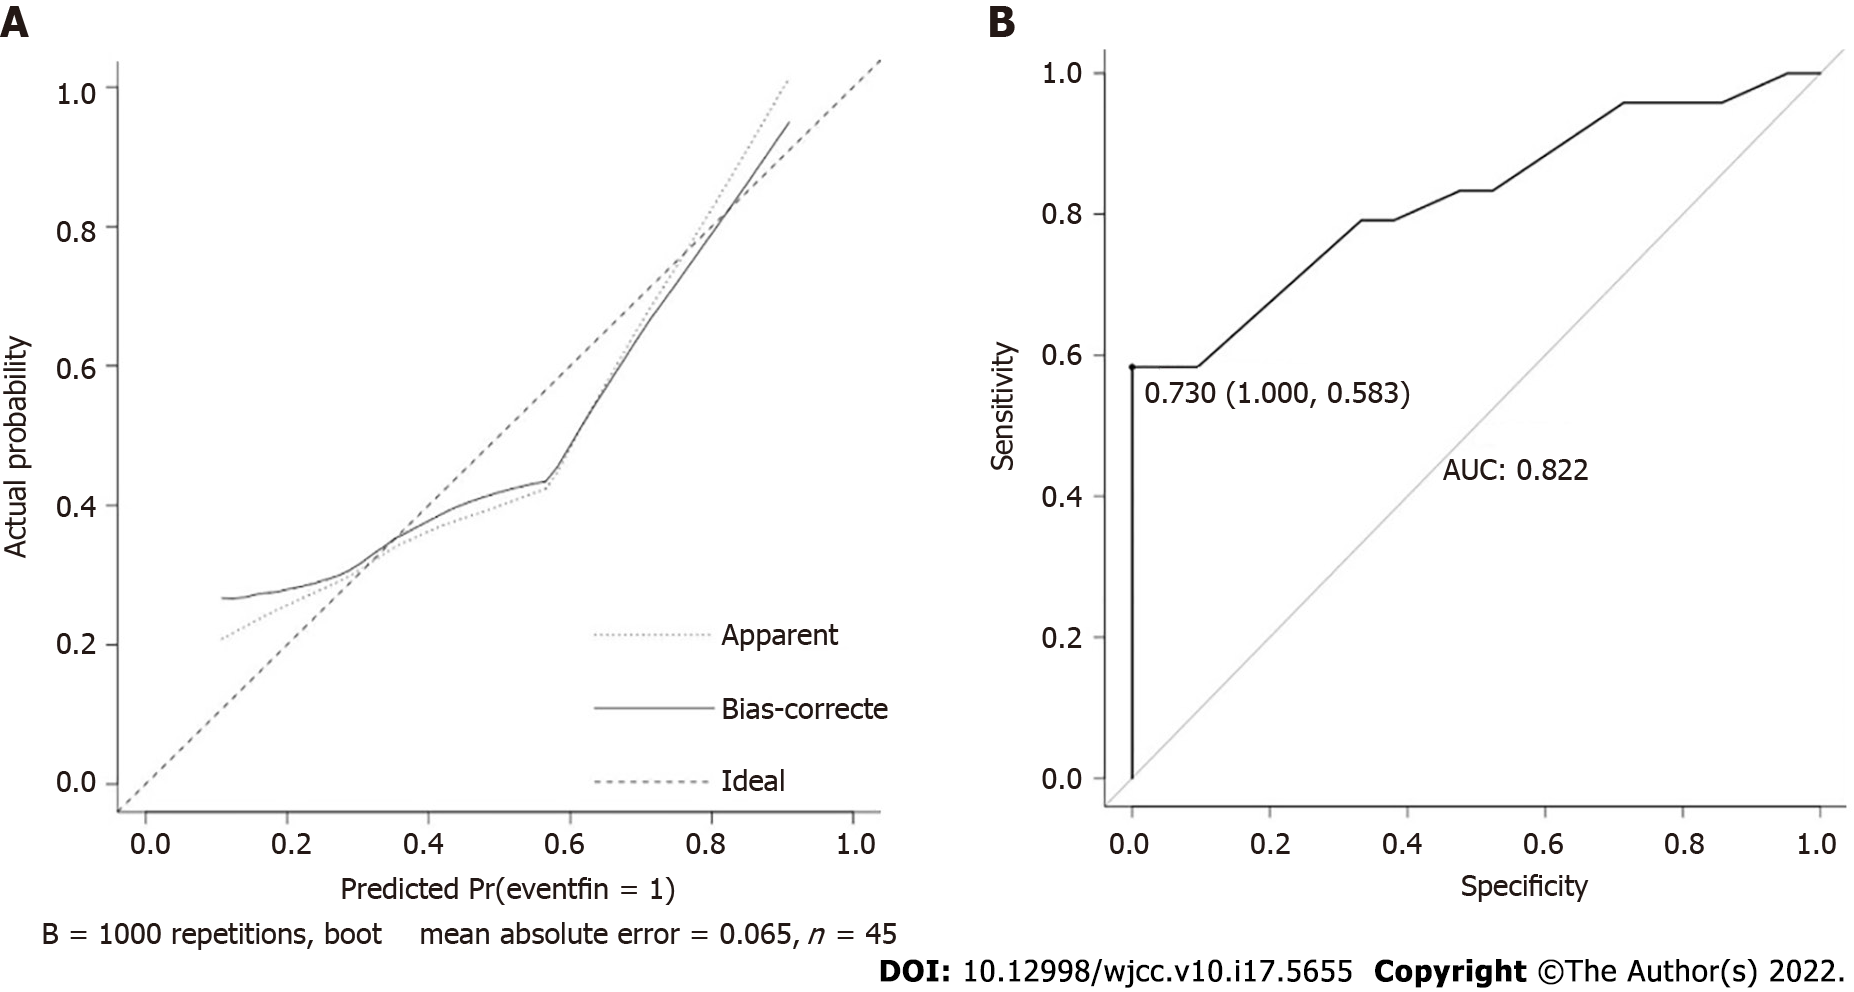
Figure 5 Calibration plots and receiver operating characteristic curve of the nomogram for prediction.
A: The calibration plot is the comparison between predicted and actual outcomes. The dashed line is a reference line, indicating where an ideal nomogram would lie; B: Receiver operating characteristic curve of the nomogram with an area under the receiver operating characteristic curve of 0.822 and an optimal cutoff of 0.730.
- Citation: Chen WN, Xu YL, Zhang XG. High Eckardt score and previous treatment were associated with poor postperoral endoscopic myotomy pain control: A retrospective study. World J Clin Cases 2022; 10(17): 5655-5666
- URL: https://www.wjgnet.com/2307-8960/full/v10/i17/5655.htm
- DOI: https://dx.doi.org/10.12998/wjcc.v10.i17.5655


