Copyright
©The Author(s) 2022.
World J Clin Cases. Apr 6, 2022; 10(10): 3222-3231
Published online Apr 6, 2022. doi: 10.12998/wjcc.v10.i10.3222
Published online Apr 6, 2022. doi: 10.12998/wjcc.v10.i10.3222
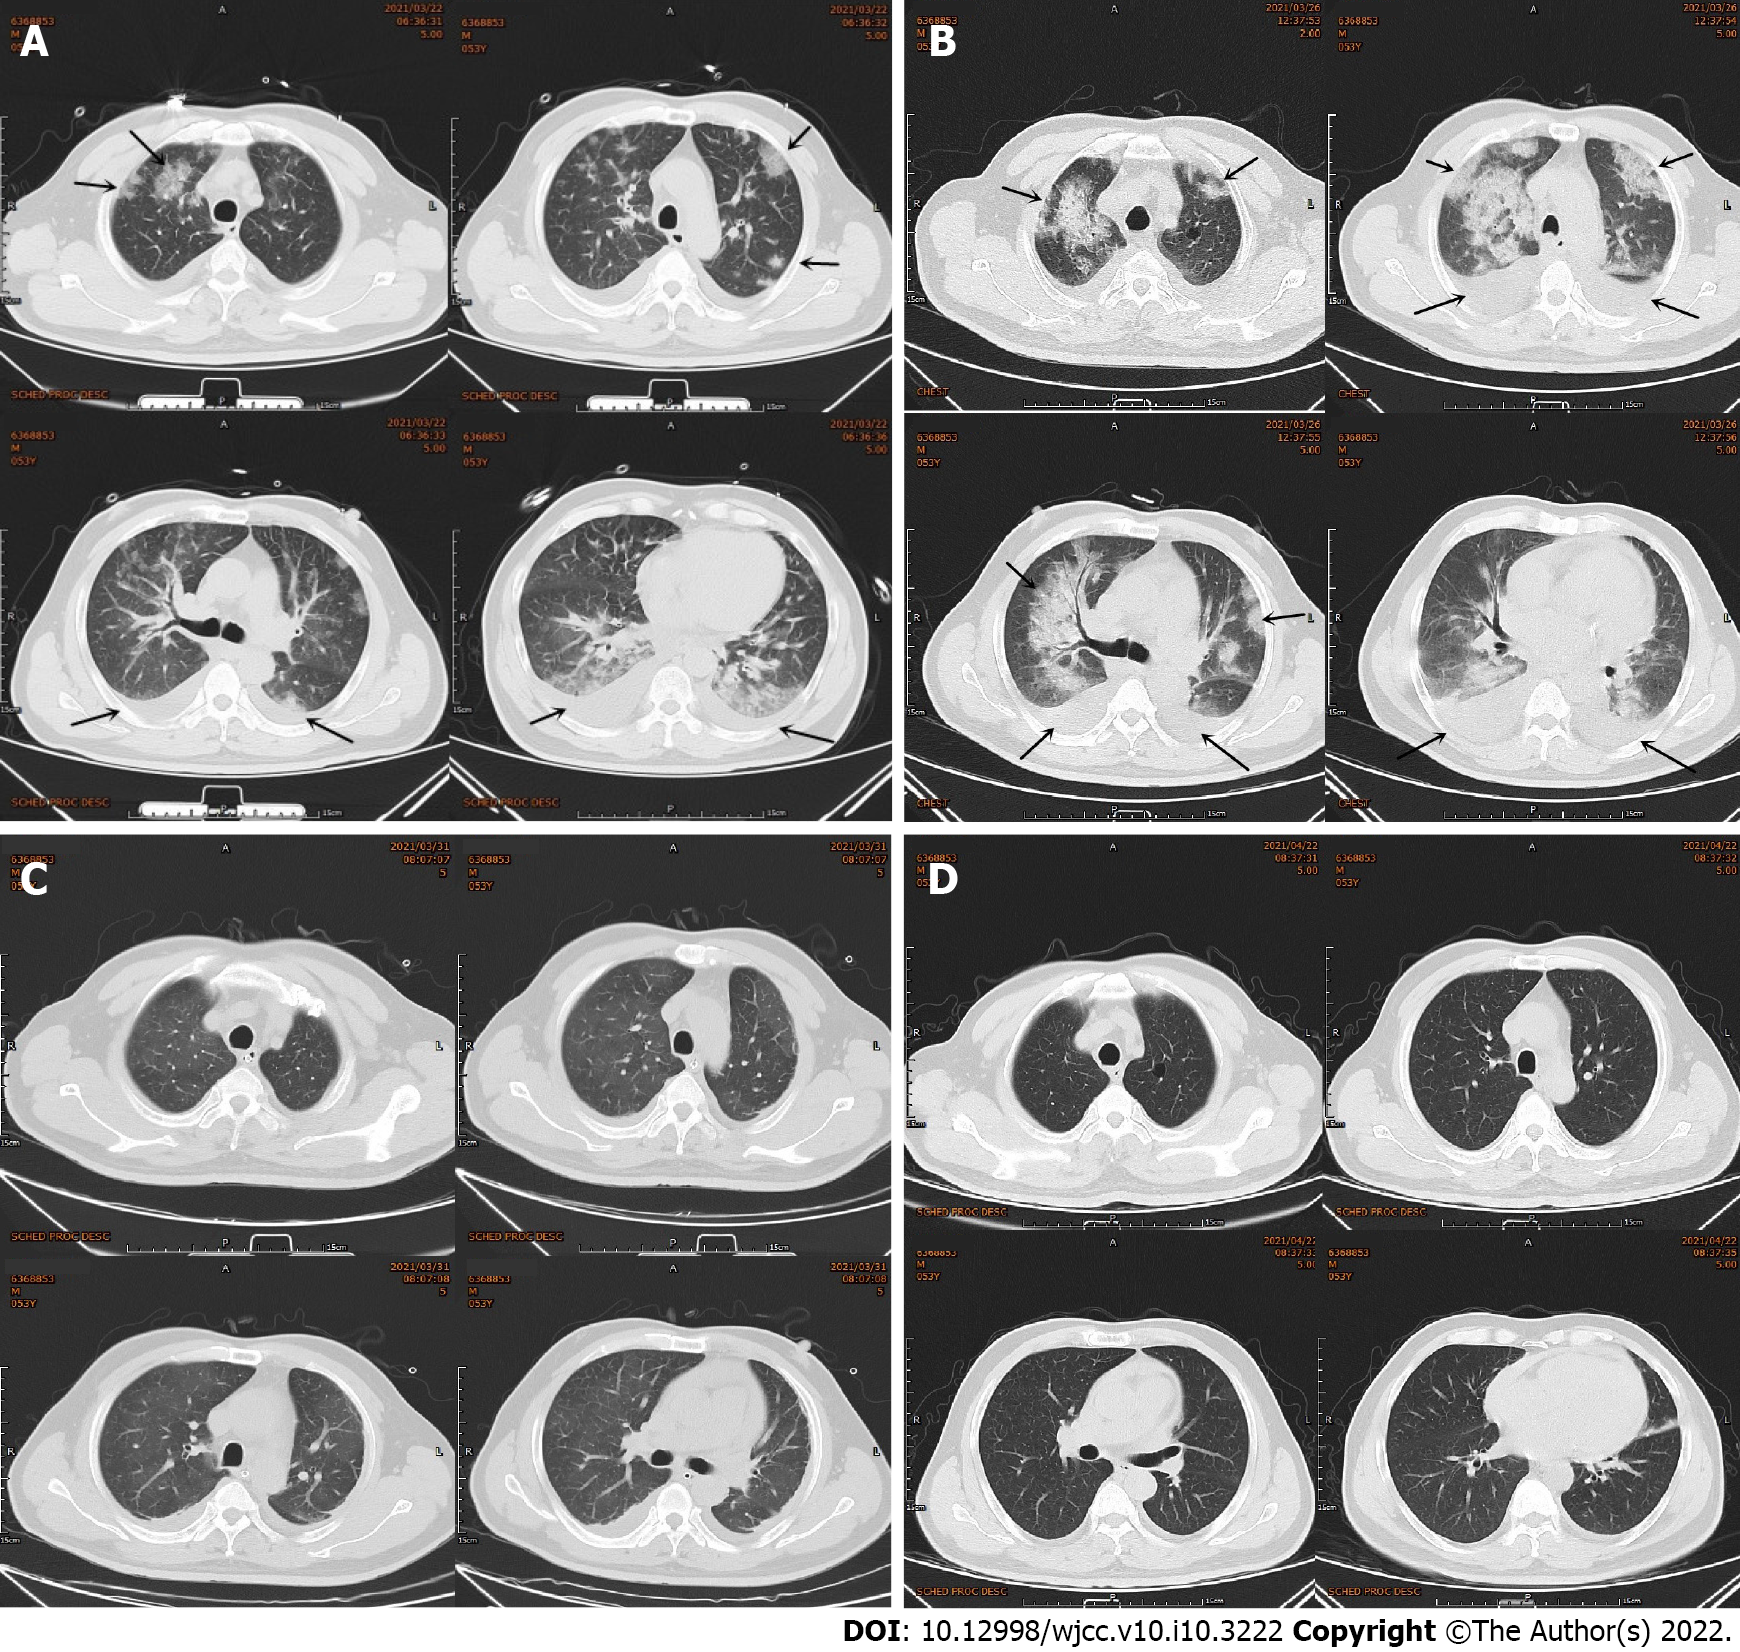
Figure 2 Chest computed tomography of the patient.
A: Chest computed tomography (CT) showed multiple patchy high-density shadows in both lungs, and bilateral pleural effusion and enlarged hilar shadows (black arrow); B: Repeated chest CT showed multiple patchy high-density shadows in both lungs and bilateral pleural effusion, which was significantly worse than before (black arrow); C: Repeated chest CT showed the multiple patchy high-density shadows and the pleural effusion were obviously absorbed; D: Repeated Chest CT showed that the patchy high-density shadows and the pleural effusion were almost absorbed.
- Citation: Liu WC, Li SB, Zhang CF, Cui XH. Severe pneumonia and acute myocardial infarction complicated with pericarditis after percutaneous coronary intervention: A case report . World J Clin Cases 2022; 10(10): 3222-3231
- URL: https://www.wjgnet.com/2307-8960/full/v10/i10/3222.htm
- DOI: https://dx.doi.org/10.12998/wjcc.v10.i10.3222


