Copyright
©The Author(s) 2015.
World J Clin Cases. Mar 16, 2015; 3(3): 322-326
Published online Mar 16, 2015. doi: 10.12998/wjcc.v3.i3.322
Published online Mar 16, 2015. doi: 10.12998/wjcc.v3.i3.322
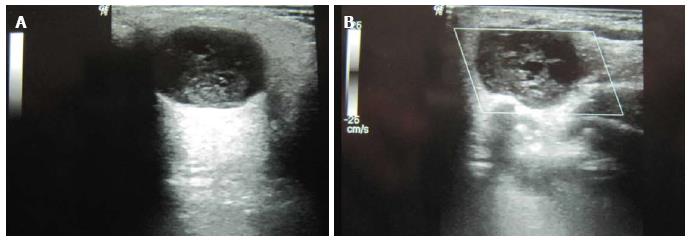
Figure 1 Ultrasound images.
A: Left parotid gland shows presence of well defined hypoechoic mass lesion in the superficial lobe with posterior acoustic enhancement; On Color Doppler (B), no internal vascularity could be demonstrated.
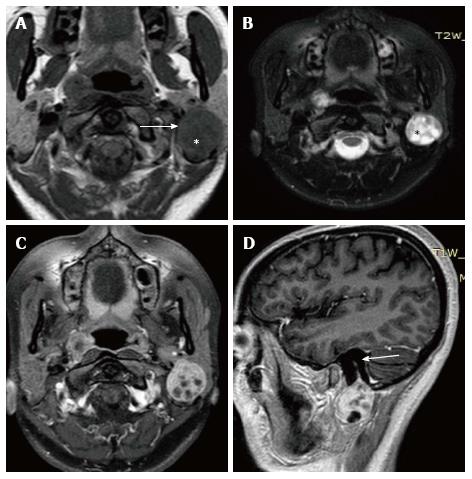
Figure 2 Magnetic resonance imaging images at the level of parotid glands-axial T1W (A), axial T2W (B), Post Gad T1W images in axial (C) and sagittal (D)planes.
Arrow in (A) shows presence of well defined intermediate signal intensity mass lesion in the superficial lobe of left parotid with hypointense areas within it (*). These regions (*) are hyperintense on T2W sequence (B) suggestive of myxomatous tissue.On Post contrast images (C and D), the mass enhances homogeneously with few non enhancing areas within. Arrow in D shows the characteristic “string sign” extending along with facial nerve in the stylomastoid foramen.
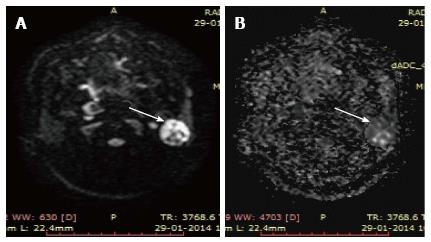
Figure 3 Axial diffusion weighted magnetic resonance imaging.
(A) At b = 1000 s/mm2 hyperintensity is noted throughout the mass (arrow) except the cystic areas. These regions were dark (arrow) on ADC map (B) consistent with restricted diffusion.
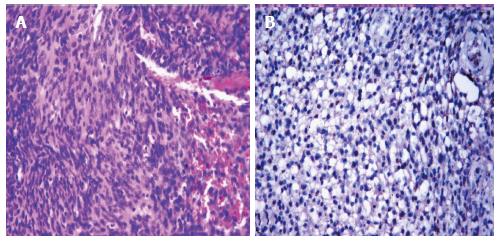
Figure 4 Haematoxylin and eosin stained section shows spindle cells arranged in fascicles (A, × 200).
The tumour cells are immunoreactive with S-100 protein (B, × 200).
- Citation: Jaiswal A, Mridha AR, Nath D, Bhalla AS, Thakkar A. Intraparotid facial nerve schwannoma: A case report. World J Clin Cases 2015; 3(3): 322-326
- URL: https://www.wjgnet.com/2307-8960/full/v3/i3/322.htm
- DOI: https://dx.doi.org/10.12998/wjcc.v3.i3.322


